


A study of 12,228 urban centres in 159 countries finds that the 200 largest dietary emitters account for 45.6% of urban food emissions while representing 39.8% of the studied population.
A universal EAT-Lancet 2.0 shift lowers global totals, yet more than half of centres record increases in each measured footprint, making local nutrition, consumption and supply-chain conditions decisive.
Cities Need Diet Strategies Built Locally
Food systems account for an estimated 25% to 34% of human-caused greenhouse gas emissions, about 70% of freshwater withdrawals and roughly 40% of habitable land use.
As urban populations grow, city food policy will increasingly influence whether nutrition improves without pushing environmental pressures beyond sustainable limits.
A 2026 study in Environmental Research Letters provides a new view of that problem. Researchers combined demographic profiles, group-specific food intake and supply-chain footprint data in MATILDA-City, a model covering 12,228 urban centres in 159 countries.
- It estimates greenhouse gas emissions, water use and land use linked to diets.
The results challenge using a single global prescription as a local climate plan.
- Full adoption of the EAT-Lancet 2.0 diet lowers the combined global footprint, but many lower-income centres with already low consumption of animal-source foods record increases.
For African cities, nutrition, affordability and production efficiency therefore have to sit beside emissions targets.
Urban Food Emissions Cluster in Few Cities
The model estimates that diets in the studied urban centres generate 5.15 gigatonnes of carbon dioxide equivalent each year.
- Asian centres contribute 51.4% of the total.
- South America accounts for 16.6%.
- Africa accounts for 11.9%.
- Europe accounts for 10.7%.
The footprint is highly concentrated.
- The 200 largest urban emitters account for 45.6% of dietary greenhouse gas emissions and 39.8% of the population covered by the study.
- The top 50 centres alone generate more than one-quarter of urban dietary environmental impacts, yet 28% of those centres lack an urban-level food plan.
Population explains much of the difference in total emissions, with an R-squared relationship of 0.810.
- It does not explain why similarly sized cities can have very different per-person impacts.
- The study attributes 48% of cross-city variation to dietary patterns and another 48% to supply-chain intensity; demographic structure explains the remaining 4%.
Animal-based foods, including meat, dairy and eggs, account for 57.3% of average urban dietary emissions worldwide.
- That global share identifies a major mitigation lever in high-consumption cities, but it cannot determine the right intervention in places where animal-source intake is already low, or nutrition is inadequate.
The Lima and Paris comparison illustrates why city size is not enough.
- The centres have similar populations, at 9.9 million and 10.1 million, yet Lima's modelled dietary emissions reach 45.9 million tonnes of carbon dioxide equivalent, compared with 15.4 million tonnes for Paris.
- Differences in consumption and the emissions intensity of nationally modelled supply chains produce the gap.
Global Averages Hide Sharp Local Differences
The EAT-Lancet 2.0 reference diet is standardised at 2,395 kilocalories per day and places greater emphasis on whole grains, fruits, vegetables, legumes and nuts, with lower quantities of animal-source foods, added sugar and refined grains.
- The researchers applied that pattern to every studied centre and compared it with current estimated diets.
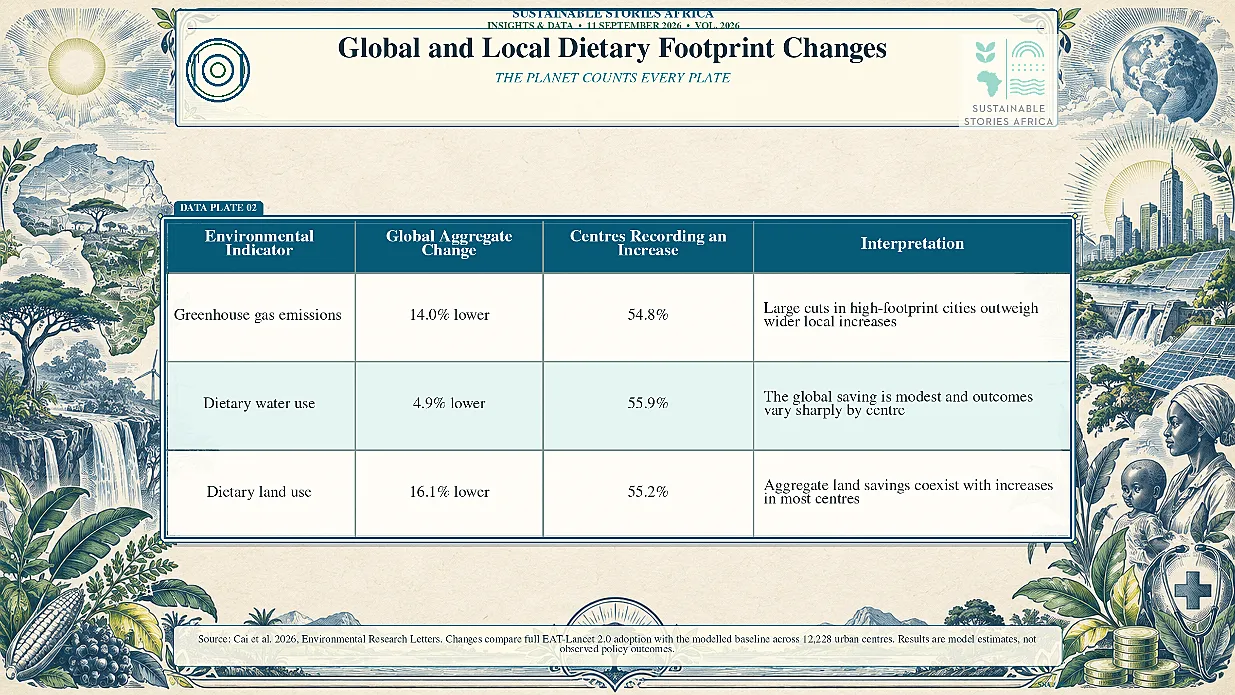
At the global level, full adoption cuts urban dietary greenhouse gas emissions by 14.0%, or about 0.7 gigatonnes of carbon dioxide equivalent.
Water use falls 4.9%, while land use declines 16.1%, a modelled reduction equal to about 156 million hectares of cropland. Those aggregate gains appear substantial.
The city-level results point in the opposite direction for the majority of locations.
- Greenhouse gas emissions rise in 54.8% of centres, water use in 55.9% and land use in 55.2%. The apparent contradiction occurs because large reductions in a smaller group of high-footprint cities outweigh smaller increases spread across many lower-footprint centres.
Meat produces the largest modelled change.
- At baseline, processed and unprocessed meat contributes 2.55 gigatonnes of urban dietary emissions, 1,419 cubic kilometres of water use and 479.8 million hectares of land use.
- Under EAT-Lancet 2.0, those impacts fall by 45.5%, 51.4% and 49.2% respectively. The potential is substantial where current intake and production intensity are high.
Targeted Transitions Deliver More Equitable Gains
High-footprint centres such as Sao Paulo, Moscow, Guangzhou, Lima and Tokyo generally cut dietary emissions by one-third to two-thirds under the EAT-Lancet 2.0 scenario, mainly through lower meat and dairy consumption.
- In Dhaka and Delhi, where current diets rely heavily on cereals and starchy staples, modelled emissions rise by 89% and 109% respectively.
City networks show why targeting matters.
- Applying the diet within predominantly higher-income member cities produces much larger reductions: 22.3% across C40 centres, 50.0% across Eurocities and 29.8% across members of the Milan Urban Food Policy Pact.
- These networks cover fewer than 2.2% of the studied centres but account for 8% of total potential reductions.
The researchers group cities into four practical archetypes.
- Paris and Berlin are consumption-focused, so diet shifts offer the main leverage.
- Jakarta and Dhaka are production-focused, making cleaner supply chains more important.
- Sao Paulo and Lima require action on both.
- Lower-impact centres such as Cairo should monitor change and protect nutritional gains while building data and institutional capacity.
For many African cities, this means avoiding policies that treat lower animal-source consumption as evidence that the food system is already sustainable or nutritionally sufficient.
The priority may be to improve access to diverse, healthy food while lowering the emissions, water use and land demands embedded in farming, processing and distribution.
Cities Need Two Levers Working Together
Municipal governments should begin with a local dietary footprint and a nutrition assessment, then set separate goals for consumption and supply-chain efficiency.
- Public procurement can change school, hospital and government menus; pricing and retail rules can steer high-footprint consumers; and food-waste systems can reduce avoidable demand.
Businesses and national governments have a parallel role.
- Decarbonising agricultural production, food processing and distribution can lower impacts without requiring nutritionally vulnerable populations to consume less.
- Investments in efficient production, reliable logistics and transparent sourcing should be measured against city-specific footprint baselines rather than global averages alone.
The evidence base also needs strengthening.
- MATILDA-City uses national food-intake patterns, demographic structure and urban GDP as a proxy for energy intake.
- It does not capture neighbourhood inequality, local food cultures, household waste or subnational sourcing in full
- City surveys, market and retail data, and better regional supply-chain information are needed before governments attach taxes, restrictions or investment targets to modelled results.
The database is therefore most useful as a screening and benchmarking tool.
- It can show where large footprints are concentrated and which lever appears strongest, while local data determine how policy should protect affordability, food security and public health.
Track progress across all three environmental indicators as well as nutritional outcomes.
- A policy that cuts emissions while increasing water stress, land pressure or food insecurity would shift the burden rather than solve it.
- Comparable city data can make those trade-offs visible before measures are scaled.
Path Forward – Measure Locally Then Tailor the Transition
Cities should use global diet benchmarks as reference points, then test them against local nutrition, consumption and sourcing data before setting targets.
High-footprint cities can move first on meat, dairy and procurement. Lower-income centres need cleaner supply chains, better food access and safeguards against nutritional harm.
Local measurement is what turns a global ambition into an equitable urban transition.