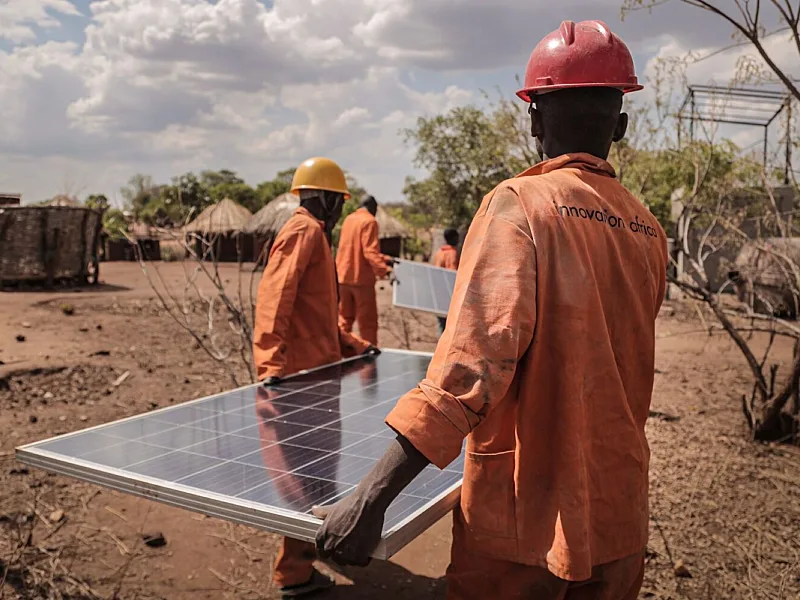
Africa could install an estimated 17 GW of solar during 2026, according to Ember and African Tech Futures Lab.
Their analysis suggests customer-side systems are expanding far faster than official records capture.
The implications extend beyond renewable-energy statistics.
Invisible generation can distort demand forecasts, network investment and utility finances, while privately financed resilience may leave poorer customers out of benefits.
The Solar Market Statistics Cannot See
Africa’s solar expansion may be substantially larger than official datasets indicate, according to a new methodology developed by Ember with African Tech Futures Lab.
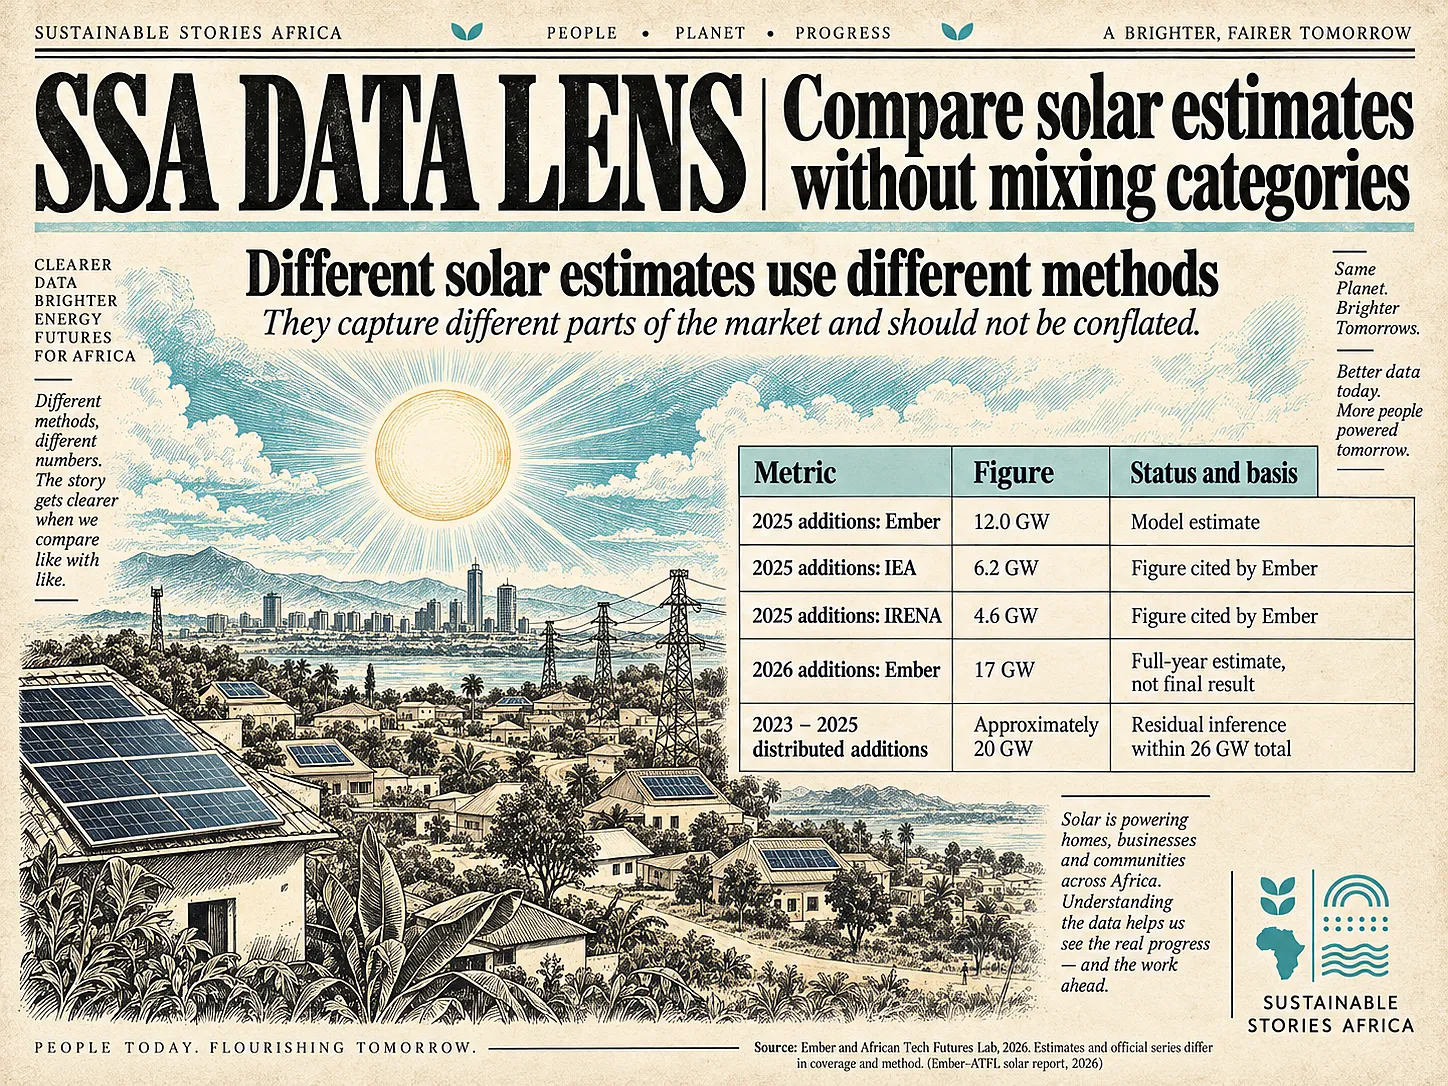
The organisations estimate 17 GW of installations for full-year 2026, about 45% above their 2025 estimate.
- As of 29 October, that remains a full-year estimate, not a completed-year result.
Their report, The take-off in African solar that official statistics can’t yet see, combines Chinese customs data with adjustments for installation timing, trade flows and domestic production.
- It argues that distributed solar explains much of the gap between visible projects and estimated deployment.
For African policymakers, this is both an encouraging market signal and a planning warning.
- Customers are investing in electricity solutions, but institutions need better evidence to understand where that supply is located and whose needs it meets.
Deployment Estimates Outrun The Official Record
For 2025, Ember estimates 12.0 GW of African solar additions, compared with the 6.2 GW IEA figure and 4.6 GW IRENA figure cited in its report.
- These are different estimates and statistical records; they should not be blended into a single definitive count.
The reporting base is uneven.
- Ember says it located official national solar-capacity reporting for 36 of 54 countries, with only 14 providing figures for 2025.
- It identifies South Africa, Tunisia and Tanzania as publishing some solar data monthly or quarterly.
That weak visibility creates a practical problem.
- An industrial rooftop may reduce daytime purchases from the utility without appearing in a national generation register.
- If thousands of similar decisions accumulate, the electricity system changes before planning assumptions do.
The result can be a mismatch between forecast grid sales and actual consumption patterns.
- It can also obscure a genuine development success: households and businesses gaining more control over supply where conventional service has been unreliable.
Customs Data Are Evidence, Not Installation Records
Ember’s methodology applies an average six-month lag between Chinese panel exports and installation, along with a calibrated installation ratio of approximately 73%.
- The calibration uses markets with stronger reporting and substantial reliance on Chinese imports, covering 368 GW of installations.
The ratio is not a physical law.
- Warehousing, re-exports, price assumptions and reporting gaps can affect the relationship between shipment values and operational capacity.
- Ember acknowledges a calibration range of roughly 60% – 90% across countries and years.
Its estimate that about three-quarters of additions in 2023 – 2025 were distributed solar is also inferential.
- The report estimates 26 GW of total solar additions and attributes roughly 20 GW to distributed systems after accounting for documented utility-scale and off-grid additions.
- This is not an installation-by-installation rooftop census.
Definitions matter.
- The report uses distributed solar principally for customer-side, grid-connected generation, distinct from utility-scale plants and off-grid systems.
- A rooftop serving an already connected business is not automatically a new electricity-access connection.
The evidence is therefore strongest as a directional market signal and a challenge to undercounting.
- It supports better measurement and updated planning, while still requiring caution about exact national totals and cross-country comparisons.
The timing adjustment is particularly relevant to an October edition.
- A methodology using customs data through June and an assumed six-month installation lag can estimate the full year before December.
- That does not mean every shipment has already reached an operating installation, or that subsequent events cannot change the result.
Country comparisons need equal caution.
- Panels may enter through one country and be installed in another, while trade records can be incomplete or delayed.
- Ember explicitly notes that some landlocked markets may be underestimated and coastal markets overestimated.
The continent-wide direction may therefore be more robust than a precise ranking between individual countries.
- Official agencies and independent analysts should treat this gap as a reconciliation task rather than a contest over whose number must be accepted unchanged.
- Installer surveys, registration data and utility connection records can test estimates and improve future calibration.
The goal is a progressively better statistical system.
- Publishing revisions, definitions and coverage makes changing figures more useful, not less credible.
- A transparent estimate with stated limitations is more informative than an apparently precise total whose omissions are unknown.
Private Solar Can Strengthen Shared Systems
Ember estimates that six markets will each install at least 1 GW during 2026:
- South Africa, Egypt, Nigeria, the Democratic Republic of the Congo, Algeria and Morocco.
- Its country estimates include 1.7 GW each for Nigeria and the DRC.
These remain modelled full-year figures, with particular uncertainty around trade through neighbouring countries.
The opportunity is larger than replacing utility sales.
- Where solar matches daytime productive demand, it can support manufacturing, cooling and services.
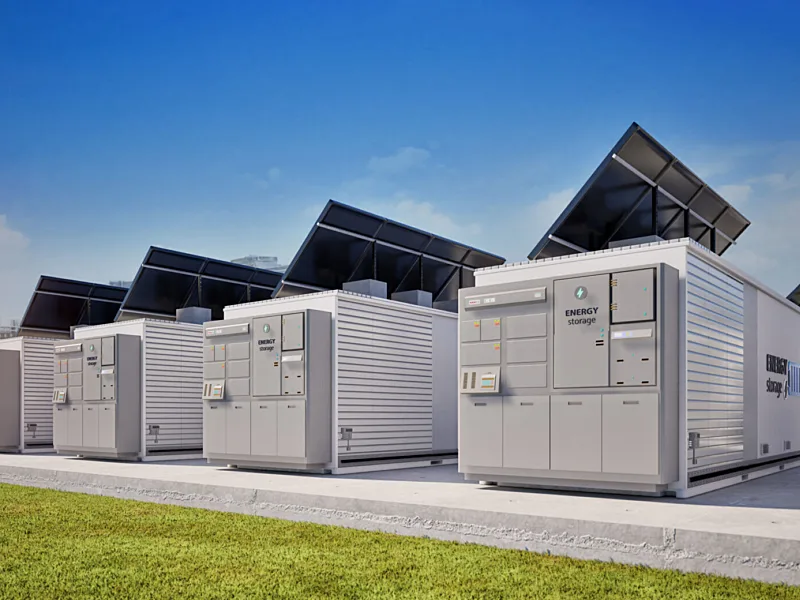
- Batteries can extend useful supply beyond sunlight hours, although performance and economics depend on system design and financing.
The report estimates that 2026 additions could generate around 23 TWh over a year of operation at a 15% capacity factor.
- It compares that with Africa’s historic electricity-demand growth.
- That is an annualised potential contribution, not a claim that every 2026 installation will generate for the whole calendar year.
Nor does matching an aggregate growth rate guarantee adequate power at every location and hour.
- Transmission constraints, evening demand and seasonal conditions remain important.
- More supply can also unlock demand previously suppressed by unreliable or expensive electricity.
The desirable outcome is a coordinated system in which customer investment complements public networks and access programmes.
- A parallel electricity economy serving only customers with available capital would leave the transition’s distributional challenge unresolved.
Make Distributed Generation Visible And Inclusive
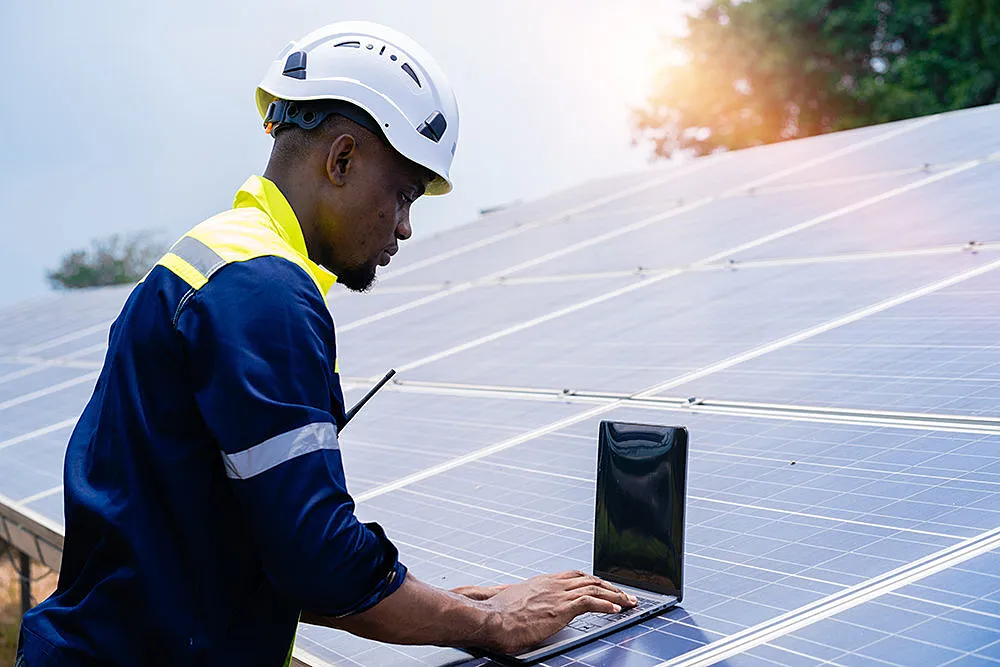
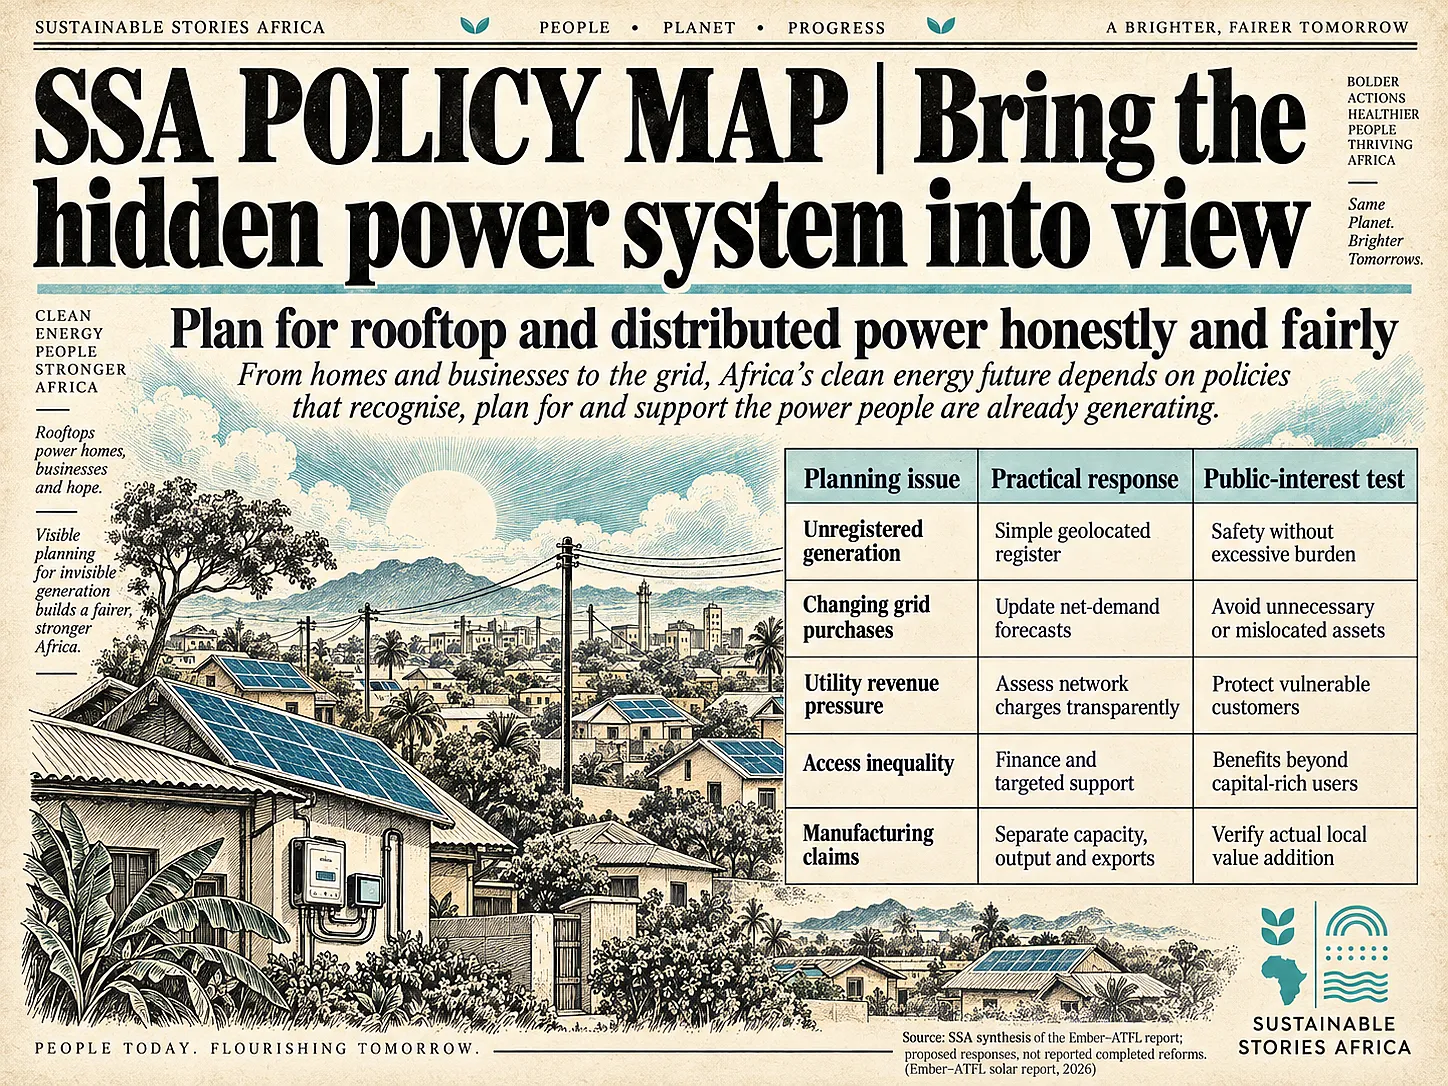
Governments should establish simple, low-cost registration linked to electrical safety and useful system data.
- Requiring location, capacity, technology and connection status can improve planning without turning small installations into a burdensome licensing exercise.
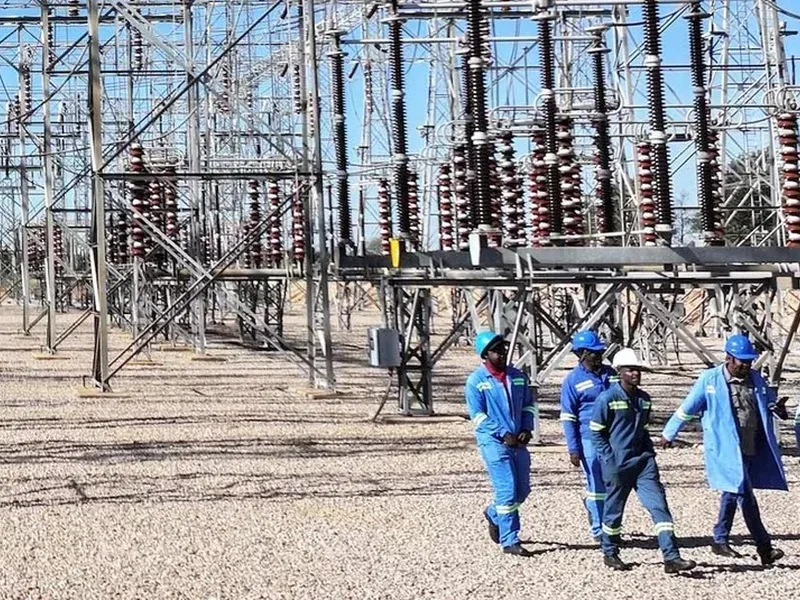
Utilities should update net-demand forecasts, feeder assessments and investment priorities as registrations improve.
- Capacity plans need to distinguish demand served behind the meter from demand disappearing altogether.
- A business that installs solar may still depend on the grid at night or during equipment outages.
Tariff reform must also address changing cost recovery.
- Ember warns that large customers reducing grid purchases can weaken cross-subsidies supporting poorer households.
- Network charges and social protection therefore need a transparent assessment rather than a blanket penalty on self-generation.
The manufacturing story requires similar discipline.
- Ember estimates roughly 3.5 GW of African panel output in 2026, while noting very limited production data and an export orientation in major new plants.
- Manufacturing capacity, actual output and panels installed domestically are different measures.
Financiers and policymakers should avoid treating panel-import costs as full installed-system costs.
- Inverters, batteries, installation, financing and maintenance all affect affordability.
- Likewise, a hypothetical diesel-displacement calculation is not a universal project payback period.
The immediate priority is institutional visibility: reconcile customs, installer, utility and national statistics; publish regular updates; and disclose methodology.
Stronger data should help integrate customer assets and extend benefits to underserved users, not simply make the boom easier to celebrate.
Path Forward – Count Solar Then Plan For Inclusion
African governments should improve distributed-solar registration, reconcile national datasets and update electricity plans to reflect customer investment.
Utilities need fair cost-recovery rules, while poorer households need access to finance and dependable public services.
Ember’s estimate signals rapid change, not complete certainty.
The policy response should combine better evidence with practical integration, ensuring the solar boom strengthens the wider electricity system.