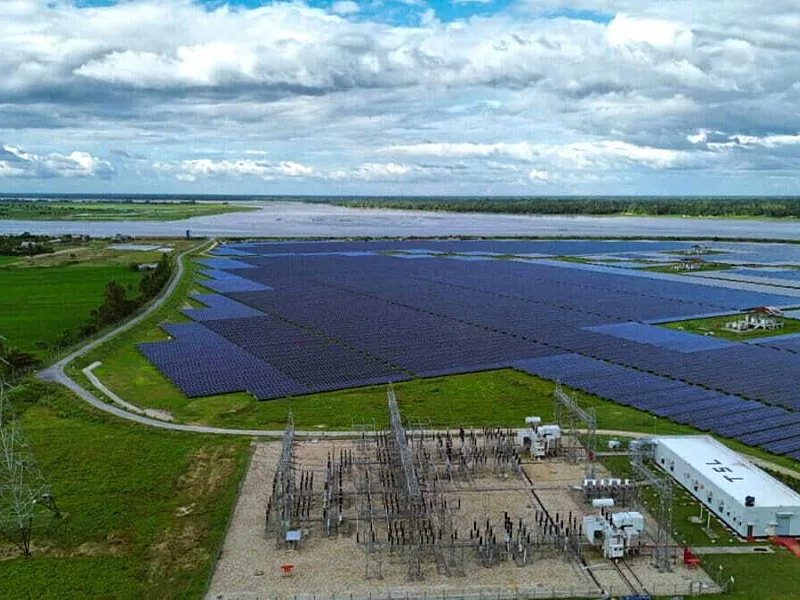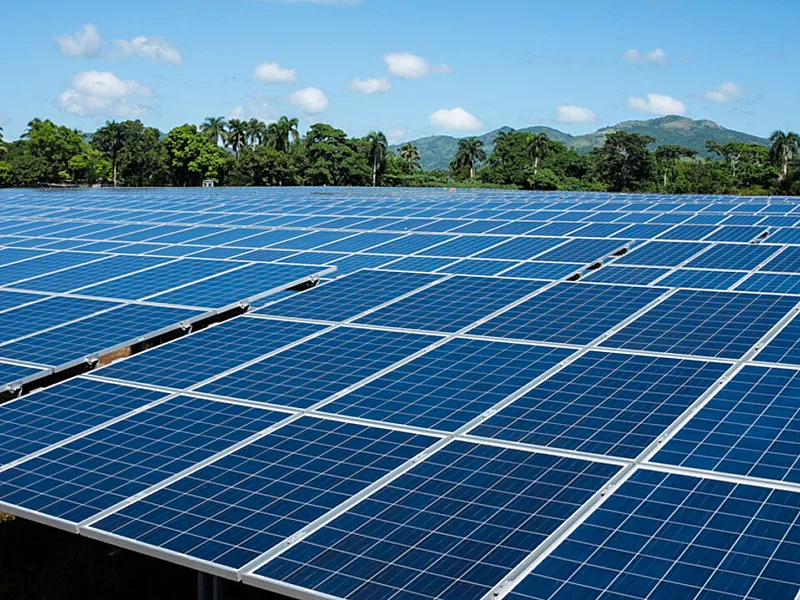
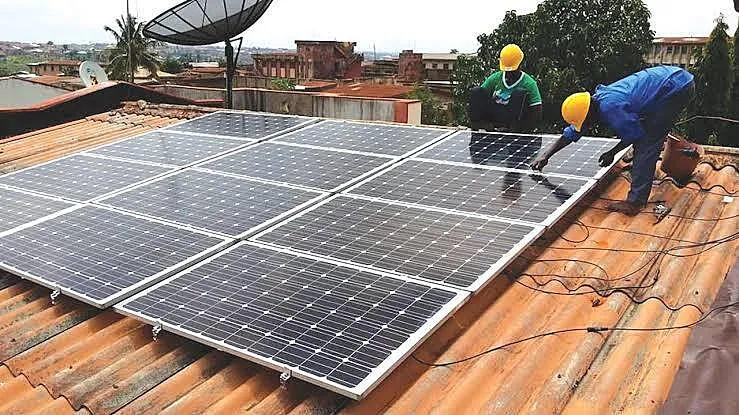
Africa is set to install a record 17 GW of solar in 2026 - about 100,000 panels a day. However, much of the expansion remains absent from official statistics.
Ember’s new estimates suggest distributed systems are driving three-quarters of recent growth.
That creates cheaper, cleaner, and more reliable power, but also exposes planning, tariff and grid-management risks governments can no longer treat as invisible.
Africa’s solar shift is hiding in the Open
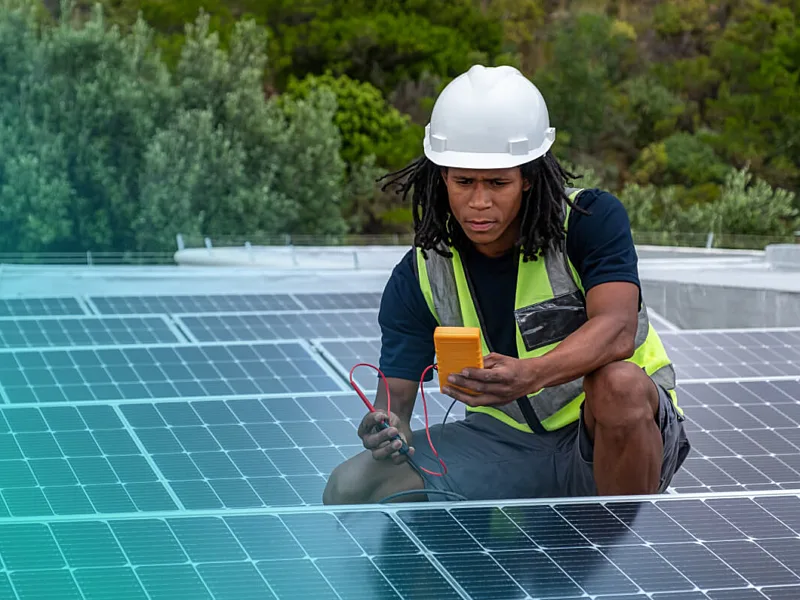
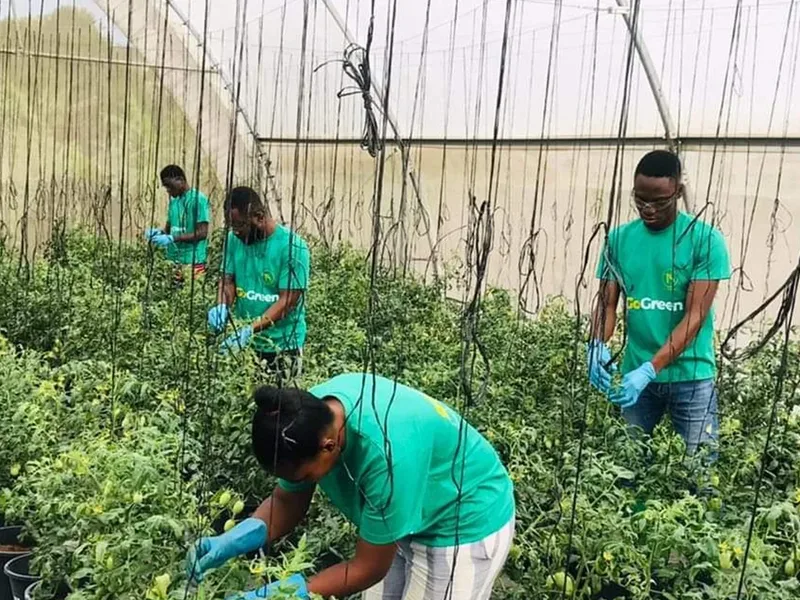
Africa’s power transition is no longer waiting for the next giant solar park. It is appearing on factory roofs, commercial premises, farms, telecoms sites and homes - often beyond the sight of national planners.
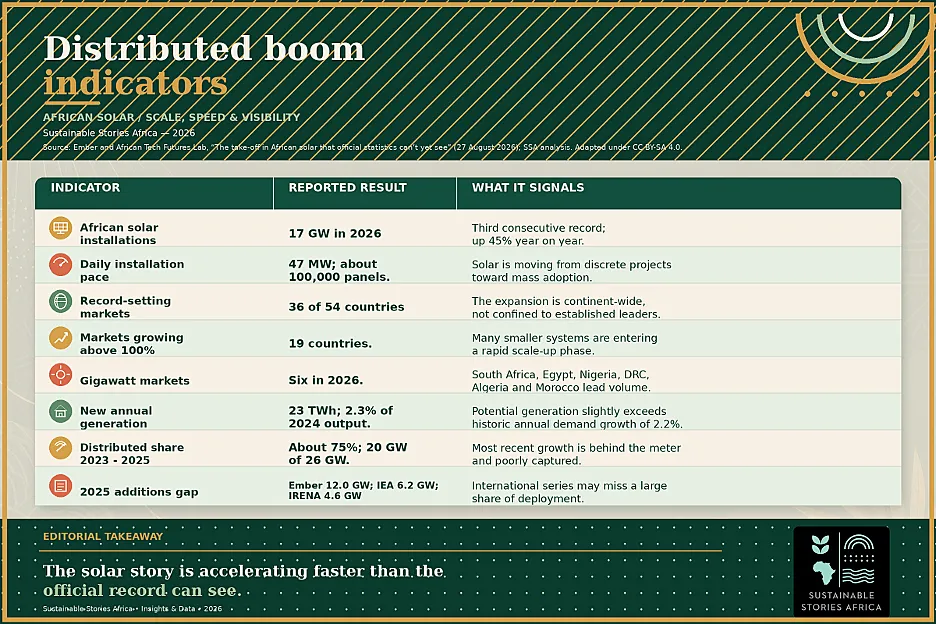
A new Ember report, produced with African Tech Futures Lab, estimates that the continent will install 17 GW of solar in 2026, 45% more than in 2025 and the third consecutive record year.
The scale is striking:
- Around 47 MW, or 100,000 panels, is expected to be installed every day.
- 36 of Africa’s 54 countries are on course for record additions
- 19 may more than double their annual installations.
This is not simply a South African story; the country’s share of African installations is projected to fall below 20% for the first time since 2019.
The more consequential finding is that statistics have not kept pace.
- The market is becoming cleaner and more distributed; however, governments risk planning electricity systems around an outdated picture of who generates power, where it is produced and when the grid is needed.
A record market beyond statistics
Ember’s estimate is built from Chinese customs data, calibrated against 368 GW of installations in markets with stronger reporting.
- The analysis assumes that about 73% of reported Chinese panel exports are ultimately installed and applies an average six-month lag, while adjusting for non-Chinese imports, re-exports and domestic manufacturing.
- That method allows exports through June 2026 to indicate full-year installations.
- Although stocking and incomplete cross-border trade data mean the country estimates should be treated as informed estimates, rather than a substitute for national registries.
Chinese panel exports to Africa reached 23 GW in the 12 months to June 2026, up 53% year on year and roughly level with exports to the Middle East.
- 6 African markets are expected to install at least 1 GW this year: South Africa, Egypt, Nigeria, the Democratic Republic of the Congo, Algeria and Morocco.
- The DRC’s estimated annual growth is 544%, Zimbabwe’s 282%, Egypt’s 176% and Zambia’s 117%.
Trade data reveals the missing boom
The new capacity could generate about 23 TWh annually, equivalent to 2.3% of Africa’s 2024 electricity generation.
- That is slightly above the continent’s average annual electricity-demand growth of 2.2% between 2014 and 2024.
- In 28 countries, the additional solar generation is expected to exceed historic demand growth.
The impact is largest in smaller power systems.
- New 2026 solar could equal 97% of Sierra Leone’s annual grid generation, 24% in Togo, 21% in Somalia and Djibouti, and 14% in both the DRC and Comoros.
- 10 countries where the increment exceeds 10% are home to roughly 190 million people.
For households and firms accustomed to outages or expensive self-generation, these additions can expand useful electricity rather than merely replace one centralised source with another.
Distributed power explains official data gaps
Ember estimates that Africa added 26 GW of solar between 2023 and 2025, including about 20 GW of distributed capacity.
- Utility-scale projects account for 5.9 GW and reported off-grid additions of just 0.2 GW, leaving roughly three-quarters of the growth on the customer side of distribution networks.
- Commercial and industrial users dominate many markets because their daytime consumption aligns with solar output and reported payback periods can be as short as two to five years.
That growth is exactly what conventional statistics struggle to capture.
- Ember puts 2025 additions at 12.0 GW, compared with 6.2 GW from the International Energy Agency and 4.6 GW from the International Renewable Energy Agency.
- Official capacity data was found for only 36 countries; only 14 had reported 2025 figures, and only South Africa, Tunisia and Tanzania publish some data monthly or quarterly.
The market evidence nevertheless keeps accumulating.
- Nigeria registered 370 new solar companies in 2025, almost seven times the 56 recorded in 2019
- Kenya’s licensed solar-firm register in 2023/2024 was around 6 times its 2019/2020 level.
The gap is therefore not evidence of weak deployment; rather, it is poor visibility.
Solar can displace costly diesel imports
The economic prize is larger than new megawatts.
- The panels China exported to Africa in the year to June 2026 cost about $2.4 billion.
- Ember estimates that producing the same electricity with diesel generators at $1.40 per litre could consume $2.4 billion of diesel every three months.
The comparison is illustrative rather than a forecast; not every panel replaces diesel, but it shows why the business case has become compelling.
Batteries deepen the shift.
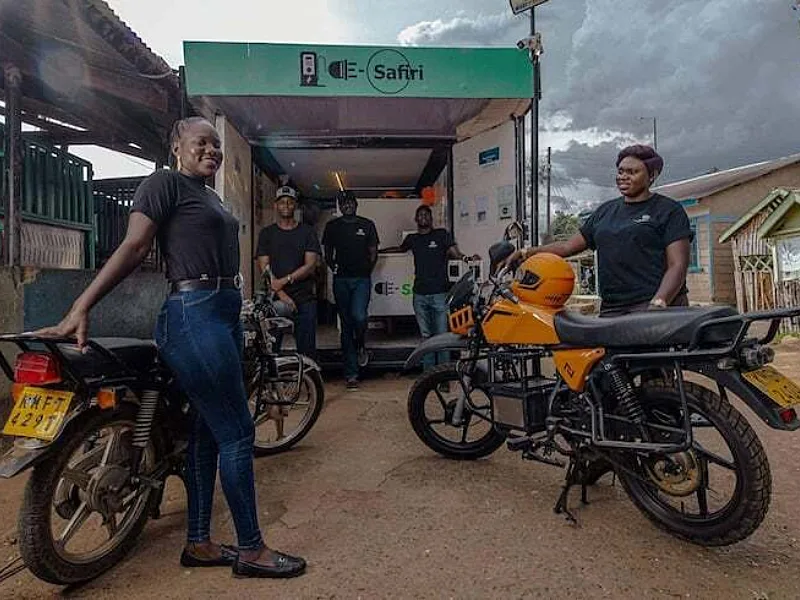
- Since 2024, Africa has imported more dollars’ worth of batteries than solar panels from China; Nigeria and the DRC lead the battery market.
- Solar-plus-storage can reduce generator use, protect businesses during outages and move daytime power into evening hours.
- It can also lower fuel-import exposure and local air pollution.
However, unmanaged adoption can weaken utility revenues as higher-paying customers leave, placing tariff cross-subsidies for poorer users under more pressure.
Manufacturing rises, but domestic links lag
Africa’s panel-manufacturing output could rise from about 800 MW in 2025 to roughly 3.5 GW in 2026, led by new plants in Egypt and Tanzania.
- That equals one-fifth of projected African installations; however, much of the output is aimed at the United States rather than African buyers.
- 94% of panels installed on the continent are still imported from China.
The industrial opportunity therefore depends on moving beyond assembly and trans-shipment.
- Egypt is adding cell production and considering wafers, glass and frames.
- Nigeria has expanded installed manufacturing capacity but several larger projects remain uncommissioned.
Transparent output data, credible demand pipelines and local procurement can turn a trade detour into durable jobs, skills and supply-chain resilience.
Make distributed assets visible and useful
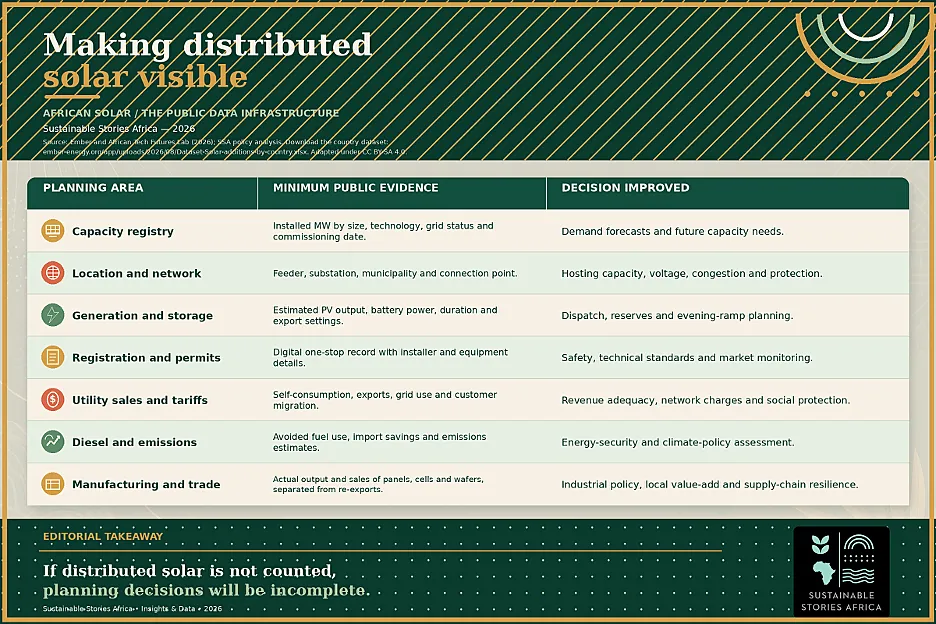
Governments should begin with simple, low-friction registration that records system size, location, commissioning date, installer, battery configuration and grid connection.
- Digital permitting should be paired with incentives to register, clear technical standards and privacy safeguards.
- South Africa’s platform, used by more than 55 municipal distributors, offers one model; at least 15 African countries are reported to have registration and permitting procedures at an advanced draft stage.
Visibility must then change decisions.
- System operators need location-specific data for forecasting, voltage management, congestion, reserves and the evening ramp.
- Regulators need it to redesign tariffs without punishing self-generation or abandoning vulnerable customers.
- Planning ministries should test new fossil and grid investments against faster distributed-solar scenarios, while financiers can aggregate smaller assets into bankable portfolios.
As Joel Nana of African Tech Futures Lab warns, distributed resources are already ‘rapidly expanding, and in many cases, overtaking grid capacity’.
Path Forward – Visibility must become infrastructure
Africa’s solar take-off is now a planning fact, even if national statistics have not caught up.
Governments should publish timely registries, integrate distributed generation and storage into power plans, and protect affordability as utility business models change.
The objective is not simply to count panels.
It is to turn privately funded, grid-edge assets into a coordinated system that improves access, reliability, industrial competitiveness and emissions outcomes - without leaving utilities or low-income customers behind.