Global foreign direct investment increased in 2025, but the recovery remained concentrated in selected economies and capital-intensive sectors.
Africa’s decline from an exceptional previous year also masks important differences between countries and investment types.
The challenge is to turn investment interest into productive capacity and essential services without letting a few megaprojects define the entire picture.
Investment Recovery Remains Uneven Across Markets
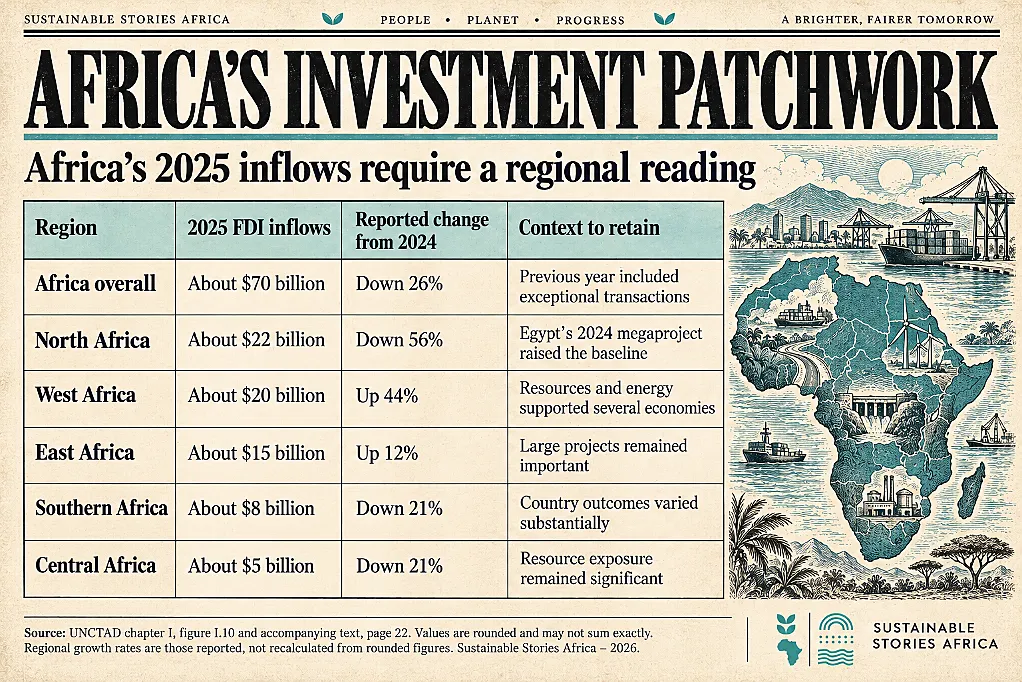
Global foreign direct investment rose by 6% to about $1.6 trillion in 2025, while Africa’s inflows fell to about $70 billion from an exceptional $94 billion in 2024.
The World Investment Report 2026 chapter presents these movements as evidence of a selective recovery rather than a broadly shared investment expansion.
Its analysis distinguishes recorded investment flows from greenfield project announcements and international project finance.
- These measures describe different activities and stages of investment, so increases in one cannot automatically be treated as equivalent increases in productive assets.
For African economies, the central issue is quality and distribution of capital.
- Large energy, extractive and digital projects matter, but their announced value does not show how widely jobs, services and income gains will spread.
Policy needs to examine execution, local connections and development outcomes alongside headline inflows.
Headline Growth Masks Concentration And Complexity
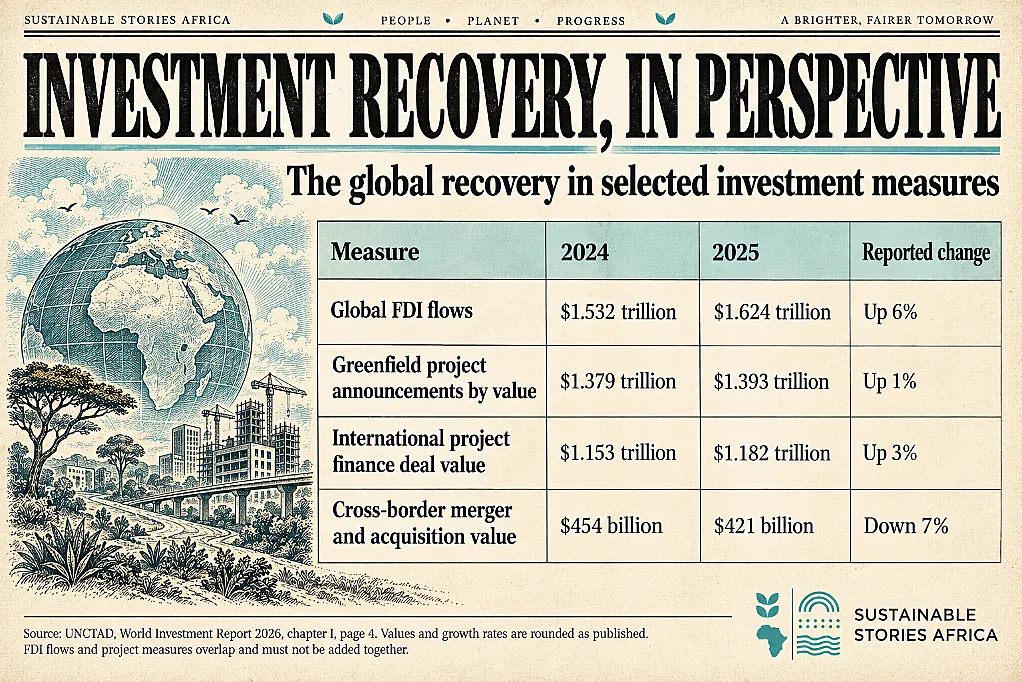
The report highlights global FDI at $1.624 trillion in 2025, compared with $1.532 trillion in 2024.
- Excluding conduit flows through major European financial centres, growth was 4%.
- Such flows can reflect corporate financial arrangements and do not necessarily correspond to new factories, infrastructure or employment in the economy recording them.
Developed economies received about $723 billion, up 11%, while developing economies received about $901 billion, up 2%.
- This divergence matters because capacity to attract large technology and infrastructure projects is uneven.
- A global recovery can coexist with persistent financing difficulties in countries with smaller projects or perceived higher risks.
Announced greenfield project value rose only slightly worldwide, while the number of projects declined.
- International project finance also showed higher aggregate value alongside fewer deals.
- This pattern points towards larger individual transactions and makes it particularly important to examine what happens outside the largest projects and host economies.
Africa Decline Reflects An Exceptional Baseline
Africa’s 2024 inflows were lifted by unusually large transactions, notably Egypt’s Ras El-Hekma real estate and construction megaproject.
The 2025 decline, needs to be interpreted against a high base.
- The report describes the $70 billion outcome as historically strong despite the year-on-year fall.
Subregional movements reinforce that point.
- West African inflows rose to about $20 billion, while North Africa’s fell to about $22 billion from roughly $51 billion.
- East Africa received about $15 billion.
The figures are rounded, and the report’s percentage changes use underlying data rather than a simple calculation from every displayed rounded value.
- Nigeria’s inflows rose to about $4 billion in the chapter’s account, supported mainly by oil and gas-related project finance.
- Guinea’s inflows reached about $8 billion, driven by mining.
These examples illustrate the role of natural resources, but they do not establish that extractive investment produces broad development gains without complementary policy and infrastructure.
The report also finds that Africa’s greenfield project values declined while project numbers increased.
- A wider set of smaller announcements can be obscured by a fall in total value after an exceptional year.
Conversely, the top ten announced projects still accounted for approximately 40% of the total announced value, showing continued concentration.
Development Benefits Depend On Investment Composition
Digital infrastructure was a strong area of global investment, supported by demand for data centres and related services.
- Such projects can improve connectivity and business capacity, but policymakers should consider their electricity, water and network requirements. The investment figure alone does not show whether surrounding communities receive affordable or reliable services.
Renewable energy illustrates why investment measures must be separated.
- In developing economies, announced greenfield renewable investment fell from about $109 billion to $55 billion, while international project finance deal values rose from about $185 billion to $224 billion.
- One measure can weaken while another strengthens because they capture different forms and stages of activity.
Water and sanitation present a different financing challenge.
- The report’s project finance table records lower deal value and fewer deals in 2025.
- Essential services with limited commercial revenue often require public or concessional support.
A strategy based only on attracting the largest private transactions can leave these needs underfunded.
Design Investment Policy Around Development Results
Investment promotion agencies should track announced projects through financing, construction and operation.
- Separating those stages would make it easier to distinguish investor interest from realised assets and services.
- Reporting can also examine employment, local procurement and tax contributions where the data are available and comparable.
Governments should improve the conditions that allow a wider range of projects to proceed, including reliable infrastructure, predictable administration and credible procurement.
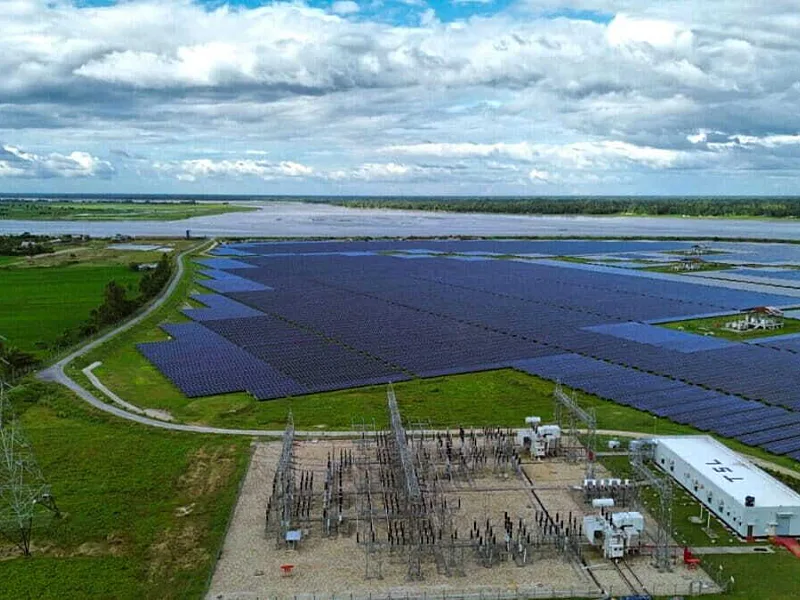
- For renewable energy, the chapter identifies financing costs, power purchase arrangements and grid integration as important constraints.
- Solving them can matter more than announcing another ambitious investment target.
Development financiers can help smaller or less commercially straightforward projects reach an investable stage, while retaining appropriate environmental and social safeguards.
- Support should be tied to a clear public purpose and assessed for additionality.
- A guarantee or subsidy is more credible when it addresses a specific constraint and its expected beneficiaries are identified.
Path Forward – Turn Investment Interest Into Shared Benefits
Africa should assess investment progress through completed projects and their contribution to productive capacity, affordable services and local economic opportunity.
Headline inflows remain useful, but exceptional transactions can distort comparisons.
The priority is to broaden the pipeline, improve execution and direct public support to identifiable development needs, while keeping financial flows and announced project values distinct.