The World Bank's FY25 project-level climate co-benefit data reveals a transition system that is expanding, uneven, and deeply political. Money is flowing, but where it lands matters even more.
Africa gains: adaptation rises in fragile states; mitigation scales in middle-income markets; and sovereign risk now shapes outcomes as much as ambition. Behind the billions are hard choices: resilience, credibility, and delivery.
Where Climate Money Truly Lands
Climate finance debates often speak in grand totals. However, development reality lives at the project level. They live in budgets, contracts, risks, delivery pipelines, and the geography of climate exposure.
That is why the World Bank's FY25 Project-Level Climate Co-Benefit (CCB) data matters. It shows not just how much is spent, but who benefits, where vulnerability concentrates, and which systems are prioritised.
FY25 demonstrates scale and direction. Approximately 48% of World Bank financing carried climate co-benefits, with IBRD and IDA climate finance increasing by 26.45% from $31 billion in FY24 to $39.2 billion in FY25.
More importantly, the regional and sectoral breakdown shows a world rearranging its climate priorities: Africa's share is rising; transport and energy are dominating mitigation; and urban resilience, food security, and human capital are gaining adaptive weight.
This data is neither academic nor symbolic. It addresses issues related to debt sustainability, FX exposure, private capital mobilisation, institutional capacity, and the everyday politics of development. It is climate policy as an economic discipline.
Climate Finance Is No Longer Abstract
FY25's CCB figures highlights energy transition's political economy in motion. Project-level data tells three stories at once:
- The regions carrying the heaviest climate burden.
- The sectors absorbing the most climate risk.
- The countries where climate money now doubles as macro-stability insurance.
The report highlights that the historical trend chart shows an unmistakable jump: climate co-benefit volume increasing significantly from FY24 to FY25, pushing climate finance close to half of the Bank's total portfolio.
Meanwhile, the regional dashboard highlights Africa's centrality; both East and West Africa collectively account for a powerful share of adaptation and mitigation combined, with notable climate allocations in transport, water, resilience infrastructure, and power systems.
This is not symbolic inclusion. It is a decisive admission: If climate finance does not work in Africa, climate challenges and credibility will collapse globally.
Following the Money, Region by Region
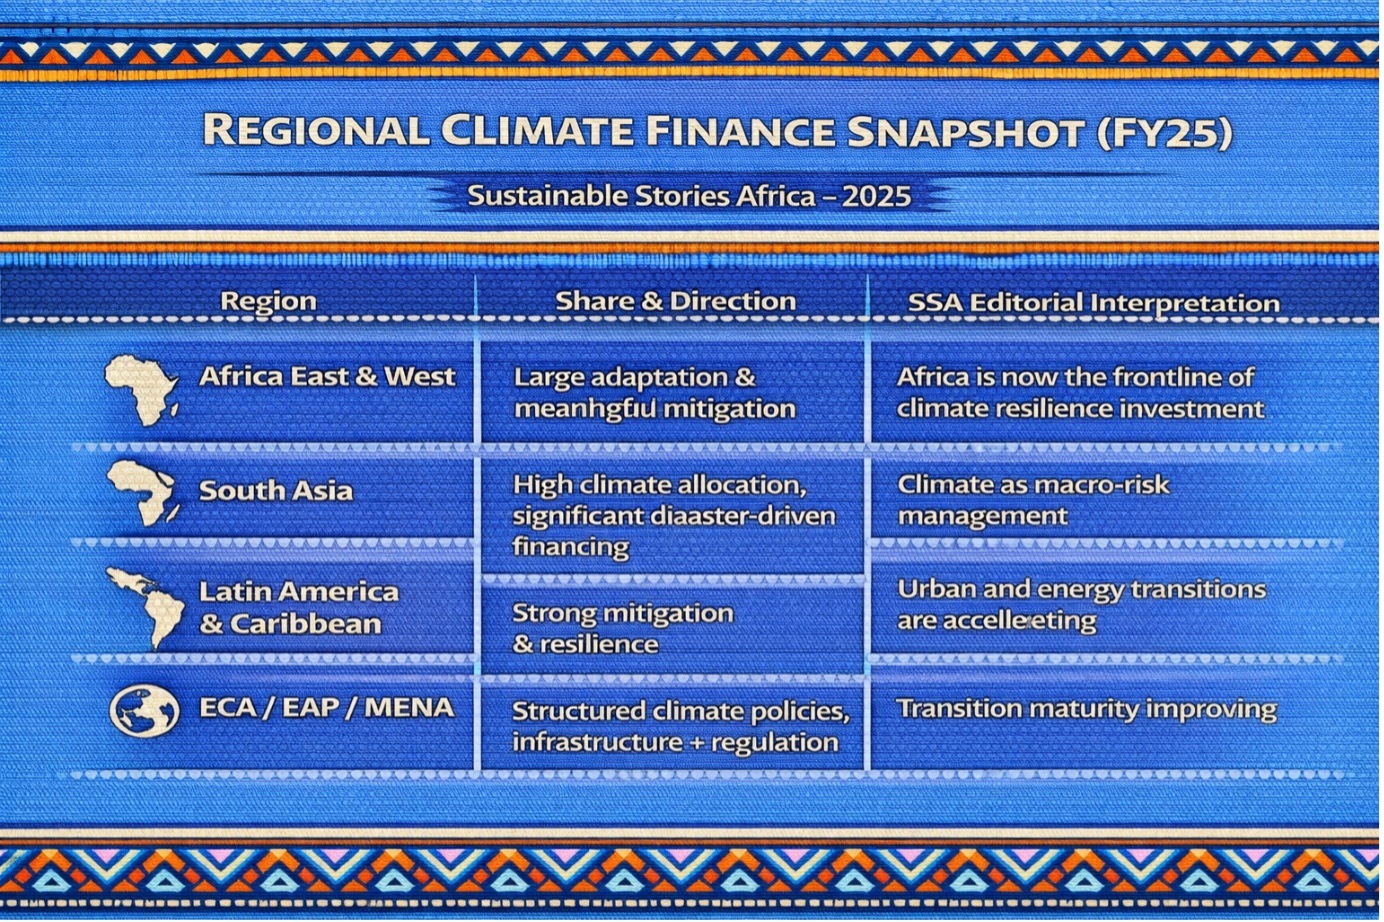
The FY25 dataset reveals a world transitioning at different speeds:
Regional Climate Finance Snapshot (FY25)
| Region | Share & Direction | SSA Editorial Interpretation |
|---|---|---|
| Africa East & West | Large adaptation & meaningful mitigation | Africa is now the frontline of climate resilience investment |
| South Asia | High climate allocation, significant disaster-driven financing | Climate as macro-risk management |
| Latin America & Caribbean | Strong mitigation & resilience | Urban and energy transitions are accelerating |
| ECA / EAP / MENA | Structured climate policies, infrastructure + regulation | Transition maturity improving |
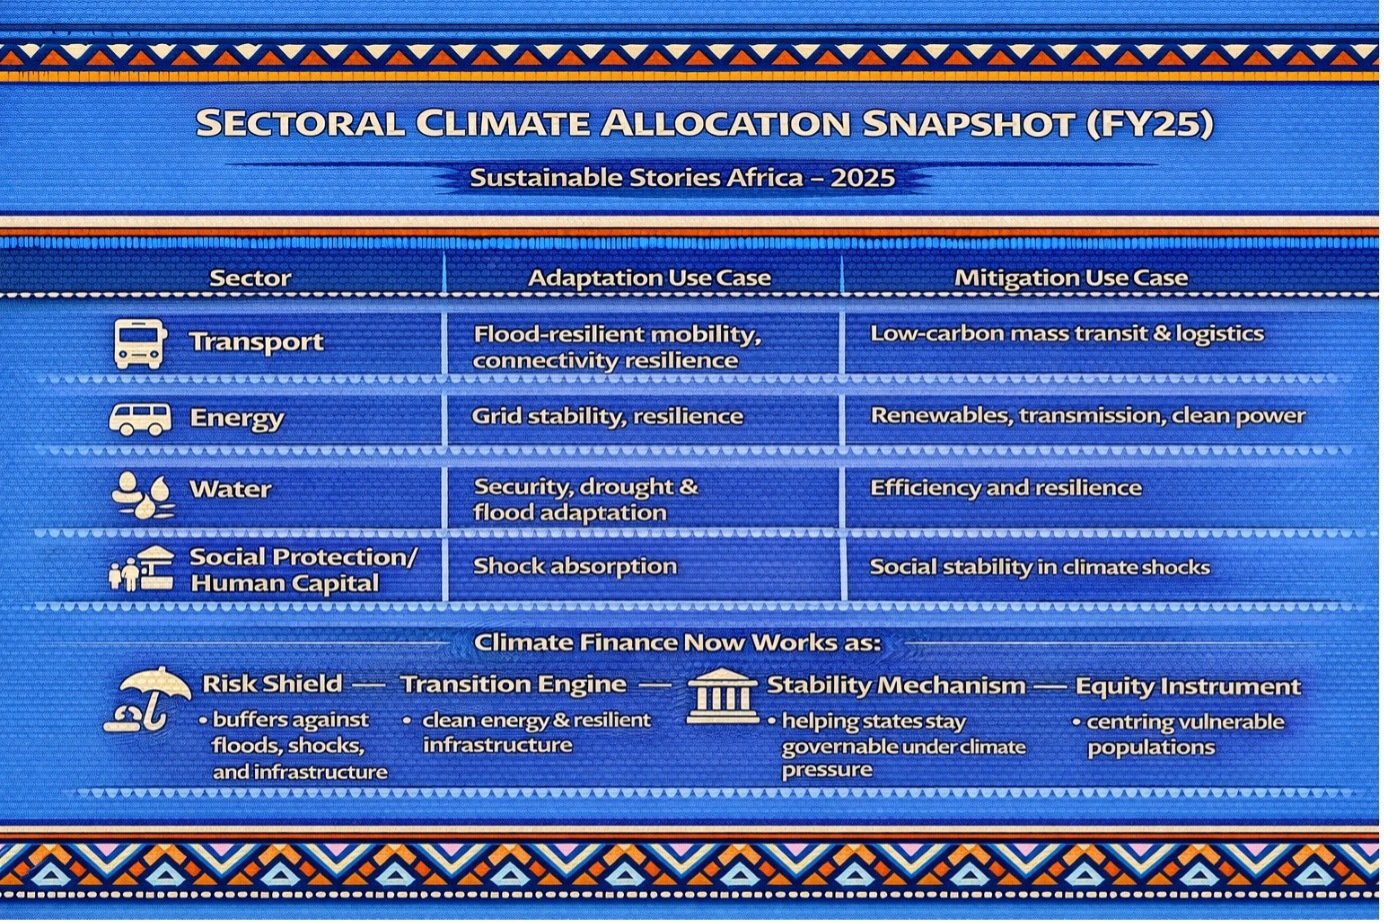
Meanwhile, sectoral analysis highlights where systems are being fortified. Transport, Water, Agriculture & Food, Energy & Extractives dominate climate-tagged financing signalling that climate action is now critical to infrastructure economics, food security policy, and energy security strategy.
Sectoral Climate Allocation Snapshot (FY25)
| Sector | Adaptation Use Case | Mitigation Use Case |
|---|---|---|
| Transport | Flood-resilient mobility, connectivity resilience | Low-carbon mass transit & logistics |
| Energy | Grid stability, resilience | Renewables, transmission, clean power |
| Water | Security, drought & flood adaptation | Efficiency and resilience |
| Social Protection/ Human Capital | Shock absorption | Social stability in climate shocks |
This is climate finance as state resilience architecture, not charity.
Where Projects Tell the Real Story
In the report's project sheets, the detail becomes compelling. Hundreds of projects illustrate climate co-benefits applied in real governance contexts.
Examples include:
- Tanzania Road Resilience and Socioeconomic Opportunities Project – 93.2% climate finance weighting, heavy adaptation allocation, reflecting infrastructure vulnerability realities.
- Ethiopia Education Transformation & Resilience Operations – climate-tagged human capital protection as resilience politics.
- Senegal Energy Access Scale-Up – high mitigation and adaptation pairing.
- Pakistan Flood Rehabilitation and Housing – climate finance acting as a post-shock economic stabiliser.
- Botswana Renewable Energy Access Accelerator – high mitigation volumes in African transition markets.
These are not abstract commitments. They are infrastructure, livelihoods, markets, and state stability.
When Climate Finance Acts as an Economic Stabiliser
FY25 project-level data highlights a system learning to protect vulnerable nations without increasing their debt burden. Many high-climate-weight projects are paired with:
- Social protection buffers
- Resilience infrastructure
- Economic transition programmes
- Disaster financing instruments
- Water & food security systems
Increasingly, guarantees and policy financing tools support climate delivery without deepening sovereign stress, especially where debt ratios and FX fragility are real.
Infographic Logic (SSA Style)
Climate Finance Now Works as:
- Risk Shield – buffers against floods, shocks, and infrastructure failure
- Transition Engine – clean energy & resilient infrastructure
- Stability Mechanism – helping states stay governable under climate pressure
- Equity Instrument – centring vulnerable populations
The story here is clear. Climate finance has transitioned to an economic strategy, rather than an ideology.
But The System Is Still Uneven
FY25 data also exposes the pressure points:
- African adaptation needs far exceed available finance capacity.
- High mitigation flows still concentrate in middle-income and structurally bankable economies.
- Fragile states depend heavily on concessional windows; pipeline readiness remains uneven.
- FX risk still threatens climate capital sustainability.
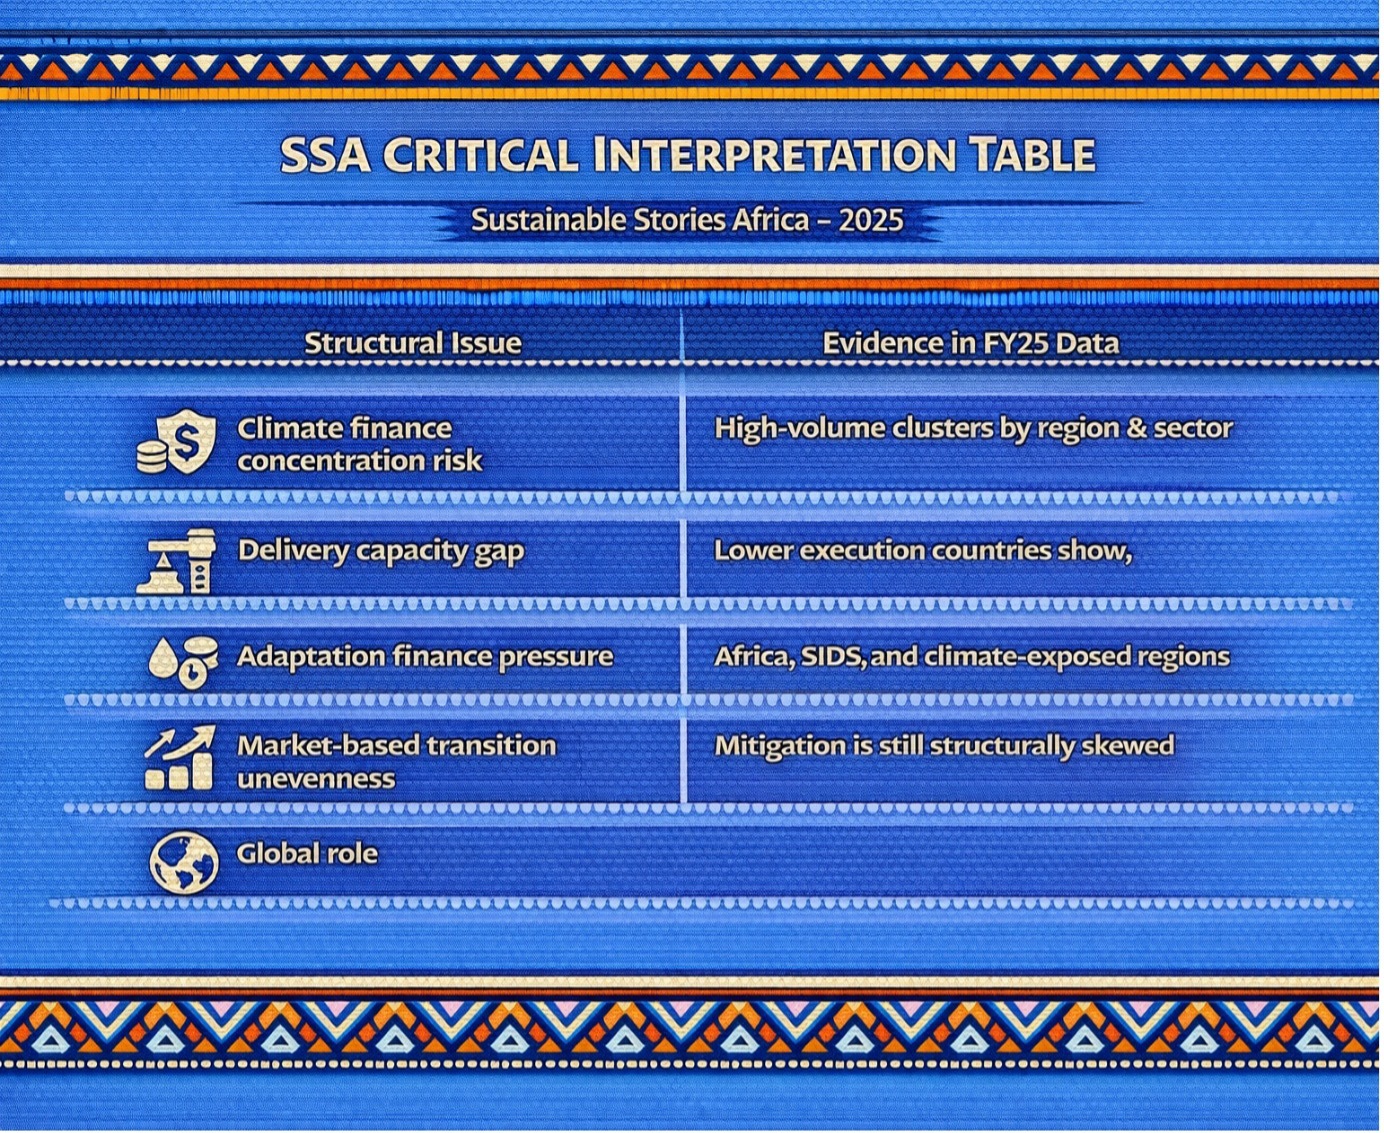
SSA Critical Interpretation Table
| Structural Issue | Evidence in FY25 Data |
|---|---|
| Climate finance concentration risk | High-volume clusters by region & sector |
| Delivery capacity gap | Lower execution countries show fewer high-weight projects |
| Adaptation finance pressure | Africa, SIDS, and climate-exposed regions |
| Market-based transition unevenness | Mitigation is still structurally skewed |
Climate finance has grown up. But credibility now hinges on execution, not declarations.
What Must Happen Next
Three imperatives emerge from FY25 CCB realities:
- Protect Sovereign Balance Sheets While Scaling Finance – Climate action must strengthen and not strain fiscal stability.
- Deepen Adaptation Finance Where Climate Reality Is Brutal – Africa, Small Island States, and climate-exposed economies must have scalable adaptation logic.
- Convert Climate Projects Into Investment-Grade Pipelines – Guarantees, blended finance, and carbon markets must accelerate private capital mobilisation.
This is where climate meets macroeconomics, and credibility becomes measurable.
PATH FORWARD – From Numbers to Discipline
World Bank FY25 project-level climate co-benefit data forces a new realism: climate finance must be financially disciplined, geographically just, and operationally credible.
Africa's central role is undeniable; adaptation financing must deepen, and transition investments must increasingly protect sovereign balance sheets while mobilising markets.
If FY25 proves anything, it is this: the transition is now economic governance.