

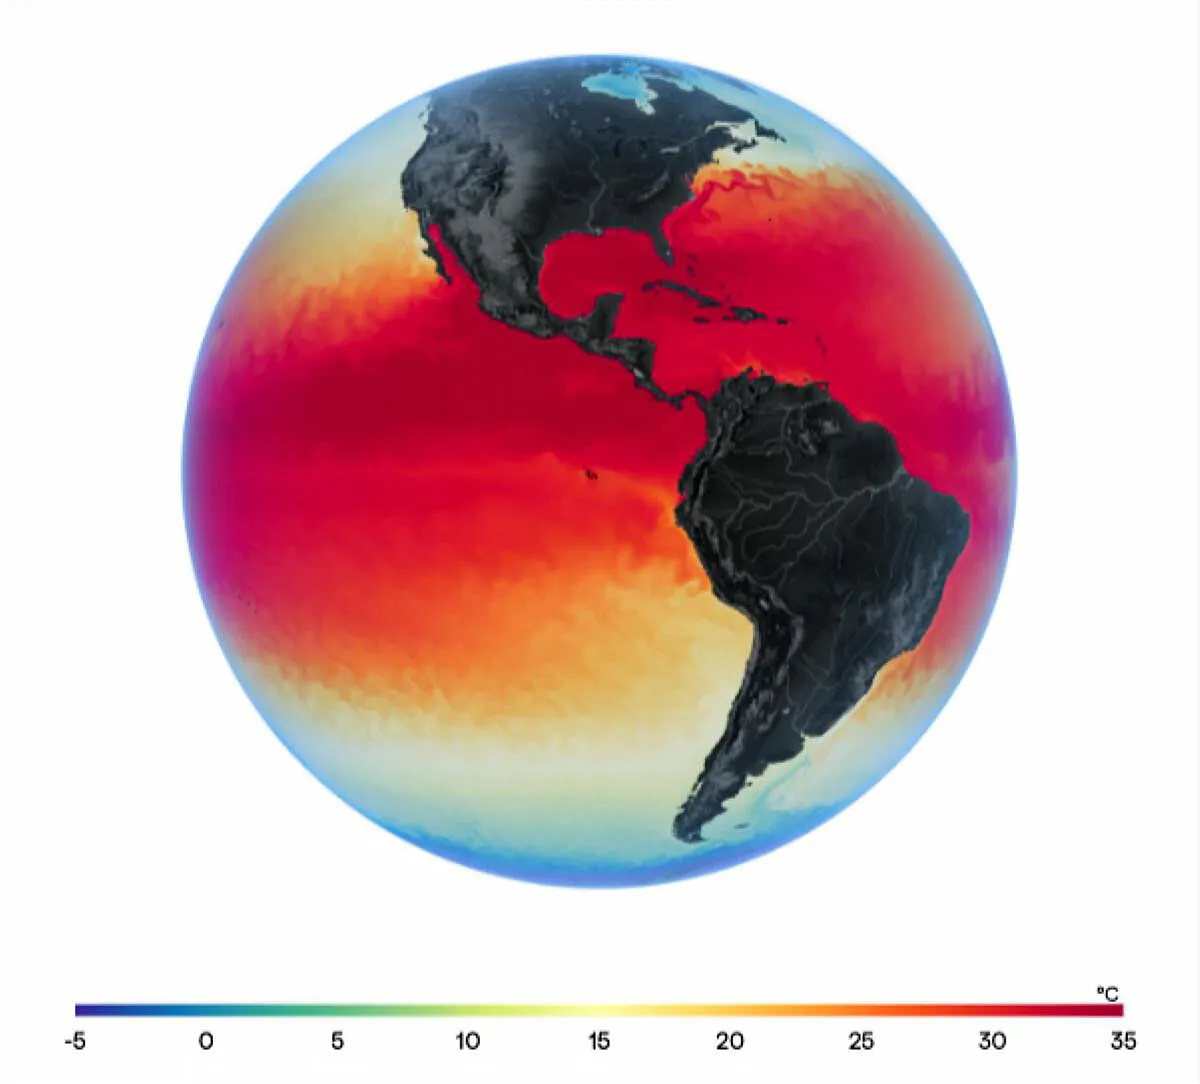
A new dataset combines satellite gravity, altimetry and Argo float observations to track how much heat the oceans absorb, and where.
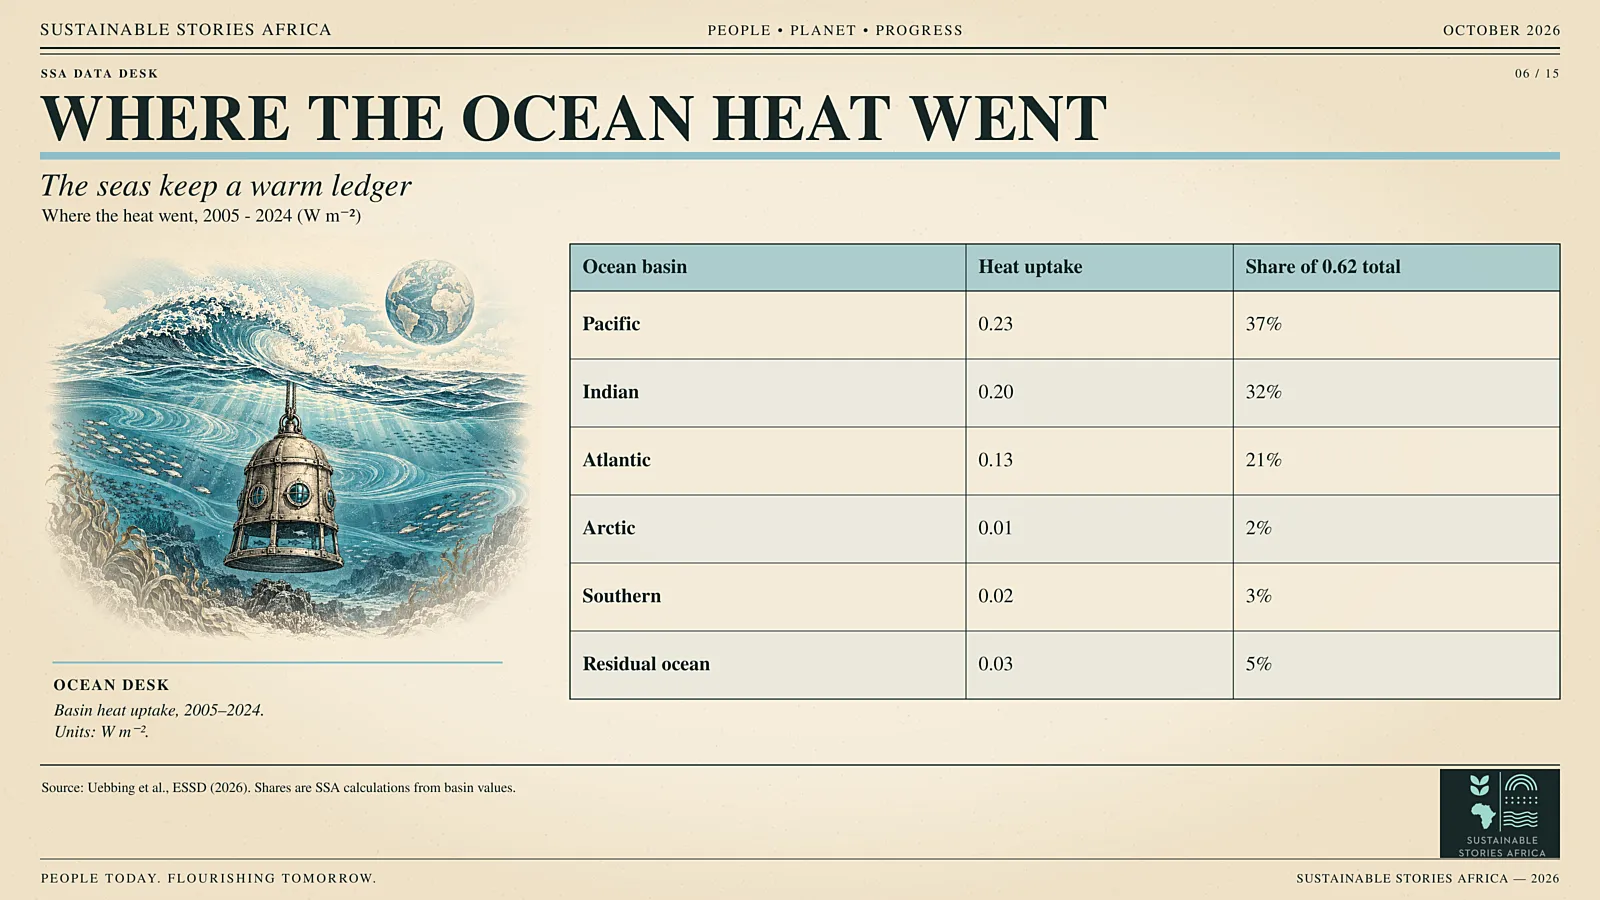
Published in Earth System Science Data, it puts average ocean heat uptake at 0.62 W m-2 for 2005-2024. For coastal Africa, regional detail matters.
Closing the Gap in Ocean Heat
Researchers led by Bernd Uebbing at the University of Bonn published the dataset on 22 September 2026.
- They estimate global ocean heat uptake (OHU) at 0.62 W m-2 from January 2005 to December 2024.
- The figure agrees well with Argo-based, reanalysis and space-geodetic datasets, as well as independent CERES estimates.
The method, called GAAMR, goes beyond the usual practice of converting sea-level change to heat with one global constant.
That constant does not hold across space or time, making regional analysis difficult.
The stakes extend to Africa, where sea-level rise, coastal erosion and ocean-driven weather shape planning from Lagos to Durban.
The Ocean Absorbs Most of Our Warming
Earth's energy imbalance, the gap between incoming and outgoing radiation, is typically 0.4-1.0 W m-2 over decades.
- The ocean takes up about 90% of it.
- Thermal expansion has contributed about 42% of global mean sea-level rise since 1993, and up to 75% regionally.
Heat holding in the ocean is therefore a direct driver of the coastal risks that African cities and ports face.
- It also underlies marine heatwaves, changes in currents and pressure on fisheries that feed coastal communities.
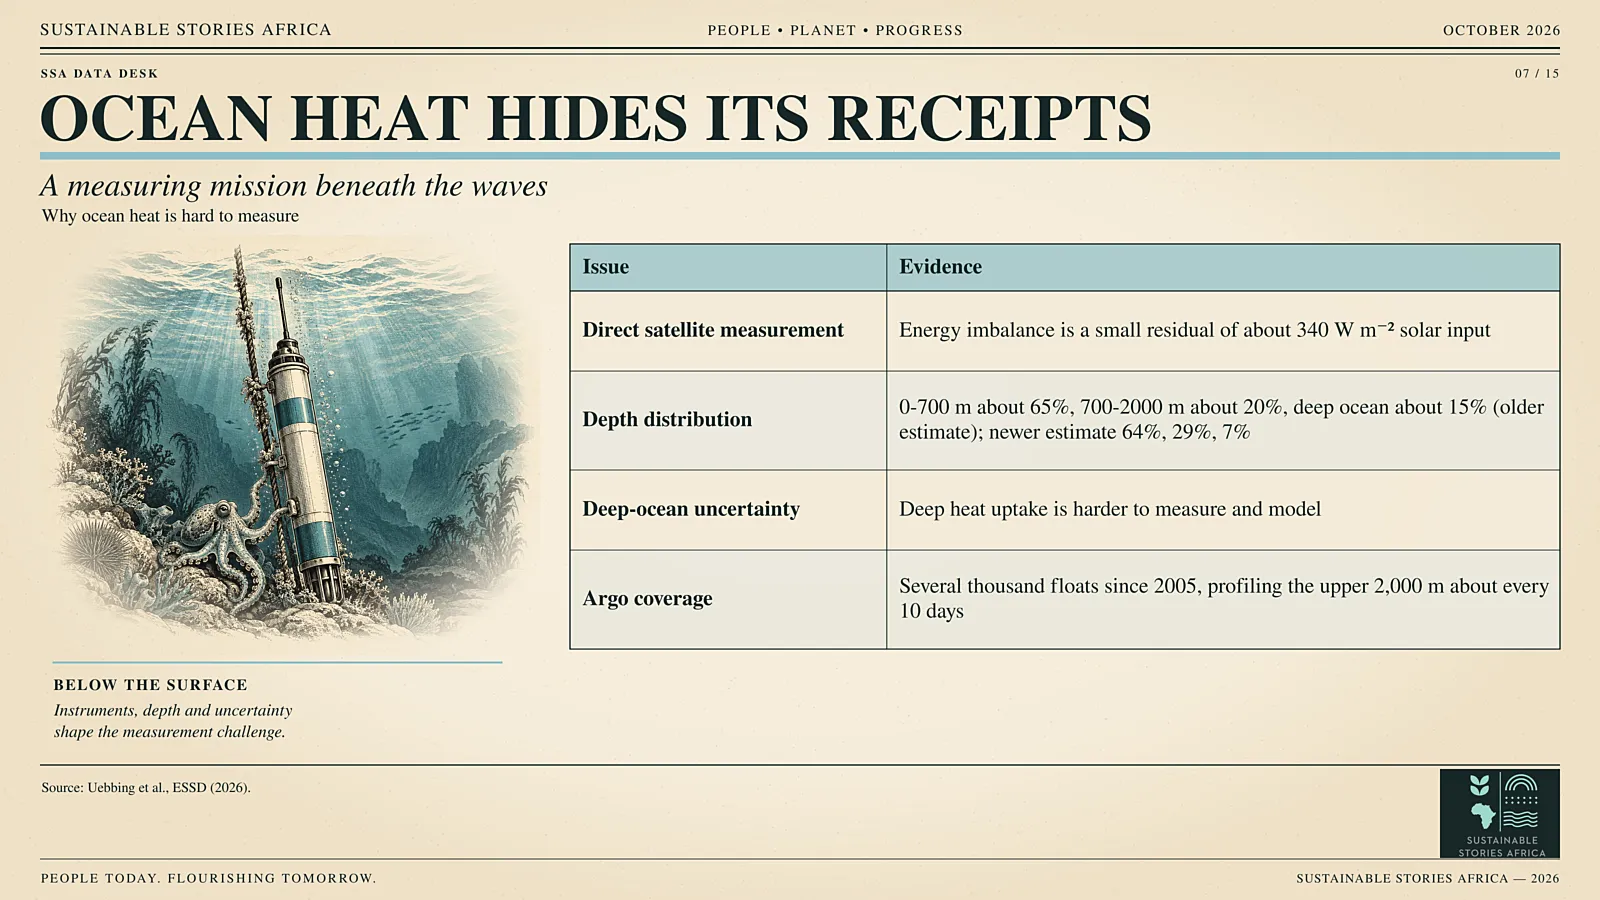
Because of the imbalance, a small residual of about 340 W m-2 of incoming solar energy remains; measuring it directly from space is extremely hard.
- Ocean-based estimates are a more reliable route, which is why improvements in the underlying data matter so much to climate accounting.
How Three Observing Systems Became One
The team fitted 486 sea-level fingerprints, 236 for mass change and 250 for steric change, to GRACE gravity, satellite altimetry and Argo profiles.
- They then rescaled modelled ocean heat content mode by mode, giving monthly gridded heat estimates with error bars.
Each system sees a different part of the problem.
- Gravity measures mass
- Altimetry measures total sea-surface height
- Argo floats measure temperature and salinity in the upper 2,000 metres.
Combining them in one inversion framework ties the pieces together consistently, instead of treating each in isolation.
The results show a shift from Indian Ocean-dominated heating in 2005 - 2015, driven by heat transport from the Pacific, toward a more even distribution across basins.
Regional Detail Gives Coastal Planners Better Evidence
The Indian and Atlantic oceans, which border Africa, account for about 0.33 of the 0.62 W m-2, roughly 53% (SSA calculation from the study's basin figures).
- That makes regional data quality a practical concern for African governments, not only for climate scientists.
Better regional heat data improves inputs for sea-level projections, marine heatwave monitoring and fisheries planning.
- The authors note that ocean warming can strengthen stratification, change currents, expand oxygen-depleted zones and speed glacier melt.
For insurers, port authorities and coastal developers, those projections translate into design standards, risk premiums and adaptation budgets.
Weak data means conservative guesses; stronger data allows targeted spending.
What Governments and Funders Should Do Next
The dataset is only as durable as the observing systems behind it.
Gravity missions, altimetry satellites and Argo floats are funded by a small group of agencies, and gaps in any one weaken the whole method.
- Governments and meteorological agencies: use open regional heat data in coastal risk assessments. The dataset is available on PANGAEA.
- Funders: sustain Argo, satellite altimetry and gravity missions, since the method depends on all three.
- African research institutions: build capacity to analyse regional ocean data for local adaptation planning.
- Insurers and lenders: ask for ocean-heat evidence when pricing coastal climate risk.
Capacity matters as much as data. Training analysts in Africa's coastal states to use such datasets turns global science into local decisions.
The Path Forward for Ocean Data
Better heat accounting starts with continuous, joined-up observation.
Governments and funders should protect the satellite and Argo networks that make this work possible.
For African markets, regional ocean data should feed coastal infrastructure, insurance and adaptation planning, so that climate risk is priced with evidence.