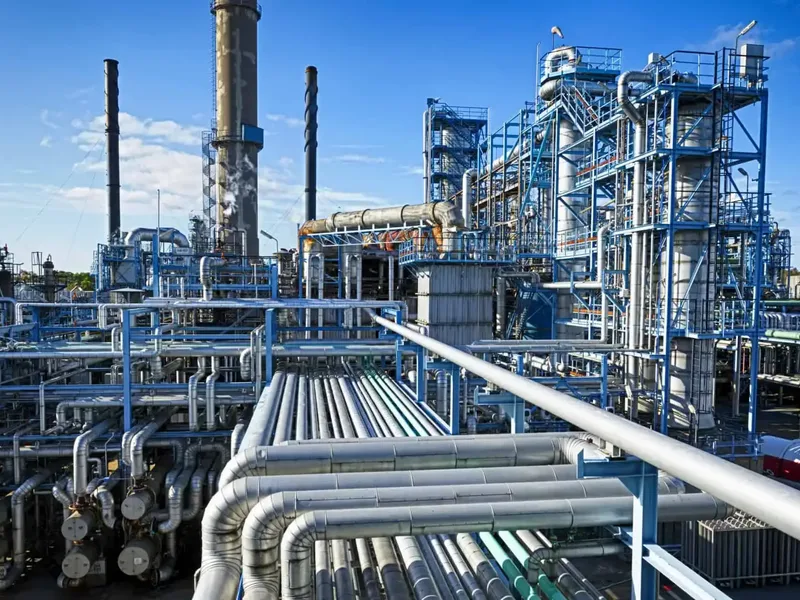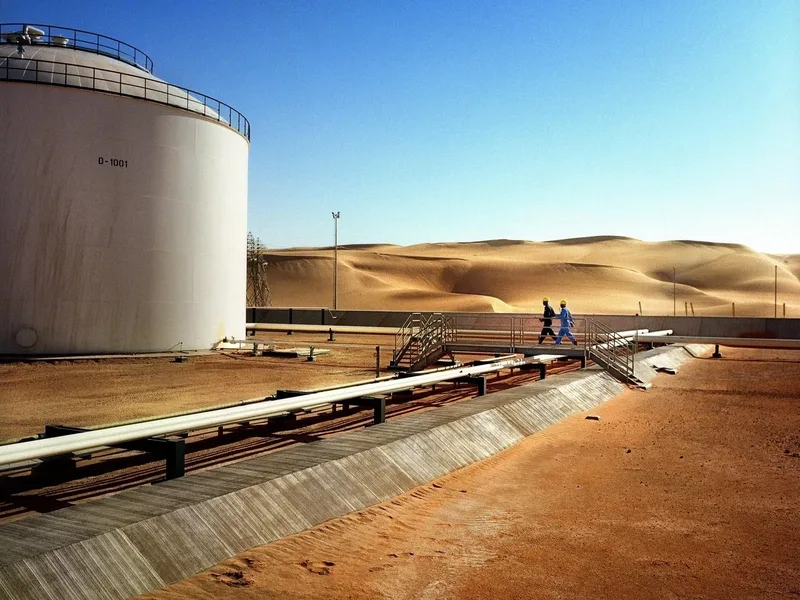

A barrel of crude oil is about 159 litres; however, refining turns it into fuels, petrochemical feedstocks, asphalt, lubricants and other products woven through everyday economic life.
That wider footprint explains why Africa’s energy transition must replace functions and infrastructure, rather than reduce one fuel at a time.
One Barrel Reaches Across Daily Life
Crude oil is often discussed as if a barrel moves directly from a well into a vehicle.
In reality, refining separates and transforms it into a slate of products that serve transportation, aviation, shipping, manufacturing, construction, agriculture, and household uses.
The barrel is therefore both an energy input and an industrial building block.
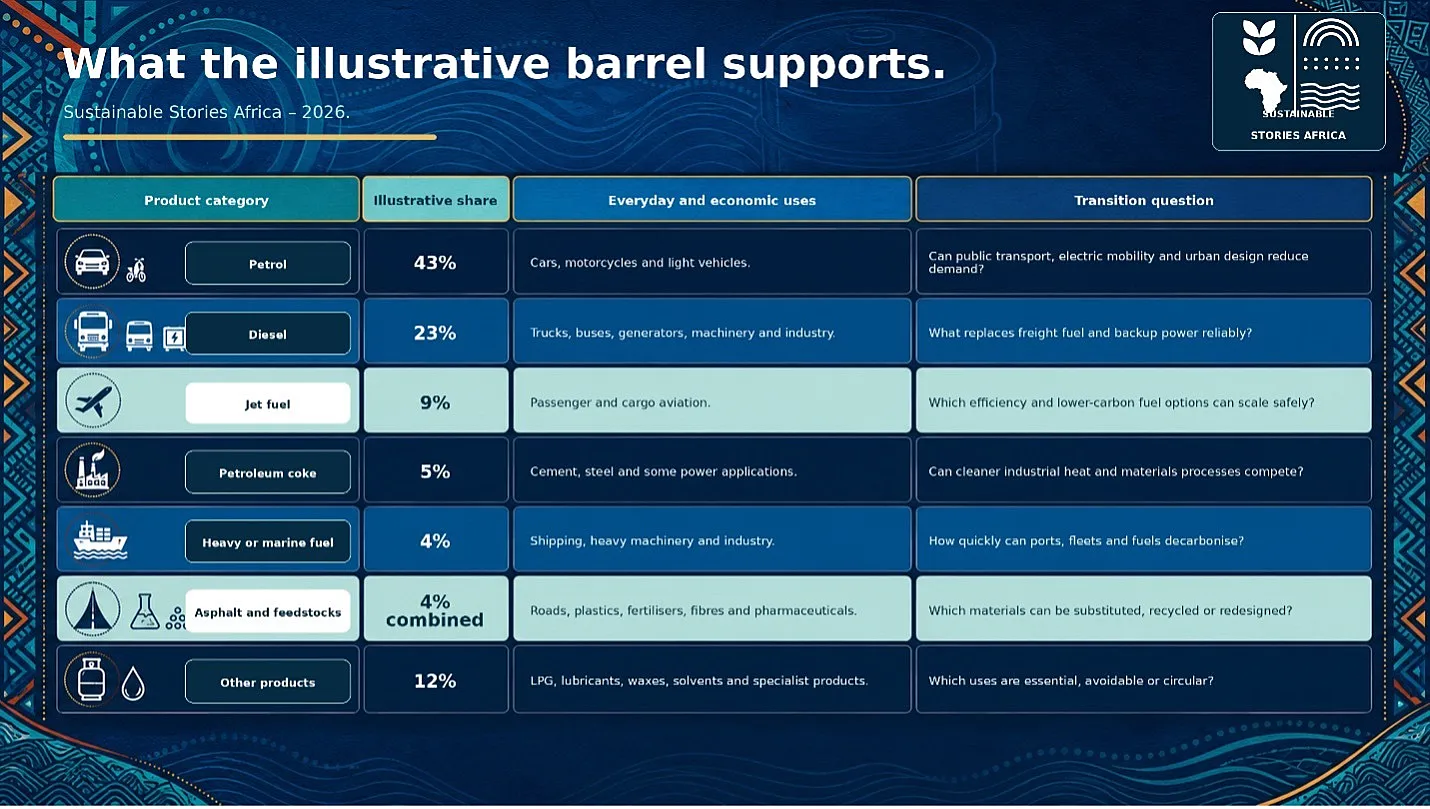
A FinPolNomics visual presents an illustrative breakdown
- 43% petrol
- 23% diesel
- 9% jet fuel
- 5% petroleum coke
- 4% heavy or marine fuel
- 2% asphalt
- 2% petrochemical feedstocks
- 12% of other products such as liquefied petroleum gas, lubricants, waxes and solvents.
Those shares tell a useful systems story, but they are not a universal refinery formula.
Crude quality, refinery configuration, operating conditions and market demand all change the output mix.
The US Energy Information Administration reports that a 42-gallon barrel can yield about 45 gallons of finished petroleum products because processing reduces product density and creates volume gain.
The lesson is not a single fixed percentage; it is how many economic functions lie inside one barrel.
Refining Turns Crude Into Many Systems
Petrol and diesel are the most visible outputs.
- They move cars, motorcycles, buses, trucks and machinery, while diesel also supports generators and industrial operations.
Jet fuel connects people and goods by air. Heavy and marine fuels support shipping and other high-energy applications, linking oil directly to international commerce.
The quieter outputs reach just as far.
- Petrochemical feedstocks become plastics, synthetic fibres, fertiliser inputs, pharmaceuticals, paints and packaging.
- Asphalt helps build and maintain roads.
- Petroleum coke is used in cement, steel and power applications.
- Lubricants protect engines and factory equipment
- Waxes and solvents enter products found in homes and workplaces.
This is why oil dependence cannot be measured only at the filling station.
A household may buy no crude oil directly and still pay for it through bus fares, food delivered by truck, medicines packaged in plastic, flights, road construction, generator-powered services and manufactured goods.
Fuel Prices Travel Through Household Budgets
For many African economies, petrol and diesel prices are transmitted through daily life with unusual speed.
- Road freight carries a large share of food and consumer goods.
- Public transport operators adjust fares when fuel costs rise.
- Small businesses often use generators when grid electricity is unreliable.
- Farmers depend on transport, pumps and machinery whose costs move with petroleum markets.
That chain turns an international crude-price shock into local inflation.
- A bakery may face higher costs for flour delivery, generator use and plastic packaging at the same time.
- A clinic may pay more to refrigerate medicines and transport staff.
- A trader may spend more moving produce from a rural market before spoilage.
The burden can arrive through many small price changes rather than one dramatic bill.
Governments also face competing objectives.
- Keeping fuel affordable can protect households and businesses in the short term, but broad subsidies can strain budgets, reward higher consumers and delay efficiency.
- Abrupt price increases without alternatives can deepen poverty and public distrust.
The durable answer is not permanent exposure or sudden withdrawal; it is a sequenced plan that expands reliable substitutes.
The barrel perspective improves that plan. If policy addresses only passenger cars while ignoring freight, backup power, aviation, roads and industrial materials, oil demand will remain embedded elsewhere.
A credible transition has to map the function of each product, the users most exposed and the infrastructure required to replace it.
Diversification Can Reduce Oil Price Exposure
Cleaner systems can reduce several vulnerabilities at once.
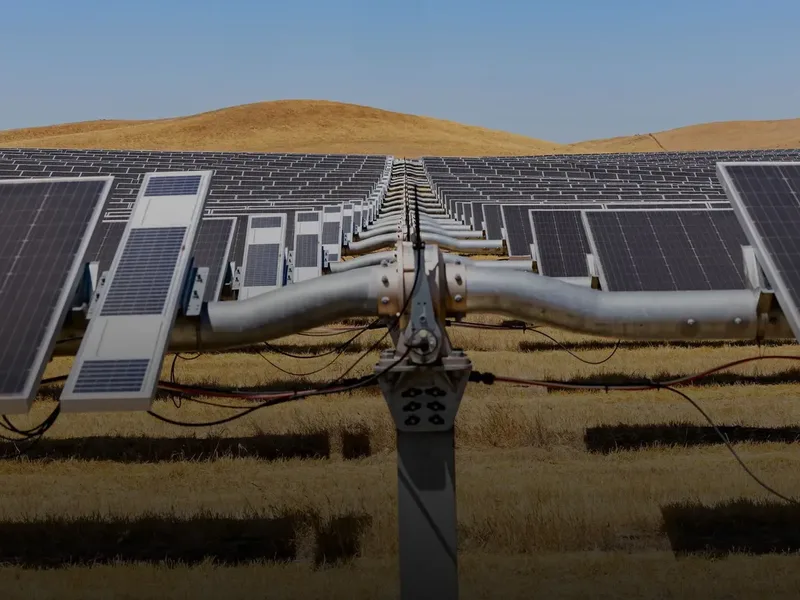
- Reliable grids, distributed solar and storage can displace diesel generators.
- Better buses and rail can lower household transport costs and fuel demand.
- Electric motorcycles and delivery fleets can fit some high-use urban routes.
- Efficient logistics can reduce empty trips, congestion and spoilage even before vehicles change fuel.
Industry needs a parallel strategy.
- Material efficiency, recycling and circular design can reduce demand for virgin petrochemical feedstocks.
- Alternative binders and improved production processes can lower emissions in cement.
- Cleaner industrial heat, green hydrogen in appropriate applications and electrification can replace some fossil inputs, but only when cost, reliability and safety are demonstrated.
The opportunity is economic, not only environmental. Countries that build local clean-energy equipment, repair networks, charging systems, recycling industries and public transport can retain more value and reduce exposure to imported fuel volatility.
Oil-producing economies can use current revenues to finance diversification rather than assume demand and rents will remain unchanged.
A just transition also protects workers and regions.
- Refining, distribution, transport and petroleum-linked manufacturing support livelihoods.
- Skills programmes, local industrial policy, social dialogue and place-based investment are needed so that cleaner systems create realistic routes into new work rather than simply close old ones.
Transition Plans Must Replace Entire Functions
The first task is a national petroleum-use map.
Governments should identify;
- Which products serve transport, backup power, cooking, aviation, industry, construction and materials
- How much is imported or locally refined
- Which users are most price-sensitive; and which alternatives are technically ready.
The second task is sequencing.
- Quick wins may include energy efficiency, generator displacement, bus reform, logistics optimisation and plastic recovery.
- Medium-term investments include grids, storage, rail, charging networks, industrial retrofits and alternative materials.
- Harder aviation, shipping and petrochemical uses require research, standards and long-duration capital.
The third task is honest measurement.
- Transition plans should track household energy costs, reliability, jobs, air quality, import exposure and emissions together.
- A policy that cuts fuel use but makes essential mobility unaffordable is incomplete. So is one that protects prices while locking cities into congestion and pollution.
Businesses should conduct the same functional assessment.
- Fleet operators can examine route economics and vehicle utilisation.
- Manufacturers can map petroleum-derived inputs and recycling options.
- Banks can finance cleaner assets while assessing stranded-asset risks.
- Oil and gas companies can disclose how capital allocation supports diversification, methane reduction and credible transition pathways.
The barrel is therefore a management tool. It makes dependence visible, prevents simplistic claims and directs attention toward the systems that must be built before fossil use can decline safely.
Path Forward – Manage Today While Building Cleaner Alternatives
Africa must keep people and economies moving while reducing exposure to volatile, polluting petroleum systems.
That requires affordability today and credible substitutes for transport, power, industry and materials tomorrow.
The transition succeeds when cleaner options perform the same essential functions more reliably, fairly and competitively.
One barrel shows the scale of the replacement challenge, and the breadth of the opportunity.