Botswana and Egypt filed new climate plans on 8 November, joining Namibia and South Africa with targets for 2035. Power generation matters in all four plans, and each measures its emissions pledge differently.
The submissions also set out the work required to protect water supplies, coastal settlements and livelihoods as the climate changes.
Four Climate Plans Put Power First
Egypt expects electricity generation, transmission and distribution to deliver a cut of about 94.7 million tonnes of carbon dioxide equivalent against projected 2035 emissions. South Africa sets an annual emissions range for its entire economy. Both give power producers a clear role in meeting the pledge, even though the targets cover different sources of emissions.
Botswana and Namibia have published detailed estimates of how much their mitigation measures could deliver with domestic resources and with international support. In Botswana, the headline model reports land use and forestry separately. In Namibia, forest and fire management contribute heavily to the headline estimate.
The four plans reach well beyond power stations. In Egypt’s Northern Delta, rising seas make coastal protection a priority. In Namibia and Botswana, drought threatens rural water supply and farming incomes. South Africa’s submission links climate spending to municipal resilience and the need to protect workers and communities as the power system changes.
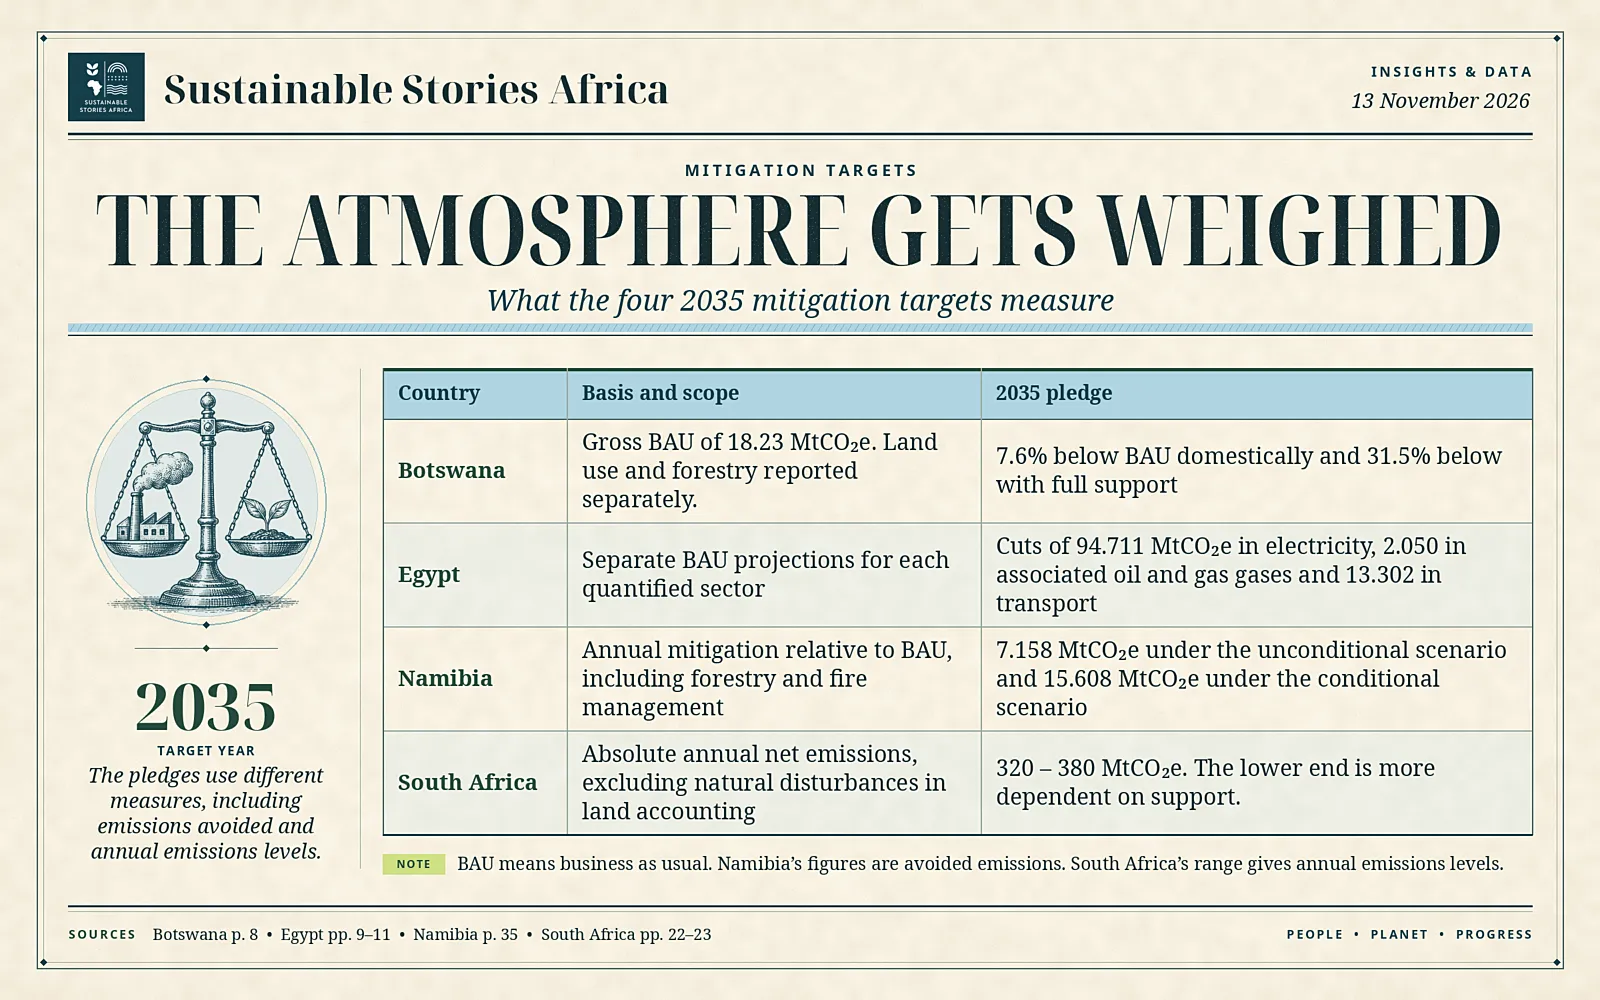
What The Four Pledges Actually Measure
Botswana’s full-support scenario puts gross emissions at 12.48 MtCO₂e in 2035, against a projected 18.23 MtCO₂e. Its domestic pathway puts emissions at 16.85 MtCO₂e. The model uses a 2022 inventory of 11.79 MtCO₂e, which makes the direction of change visible even when a percentage is quoted without context. Electricity demand and the timing of renewable additions shape the gap between the two pathways.
Egypt’s plan sets quantified targets for electricity, associated gases from oil and gas production, and transport. The 2035 electricity projection is 249.240 MtCO₂e under business as usual and 154.529 MtCO₂e with mitigation measures. The gap belongs to the electricity sector. Egypt also identifies industrial measures such as reducing clinker use in cement and improving energy efficiency.
The absolute differences within each plan can tell a story of their own. In Egypt, transport is projected to avoid 13.302 MtCO₂e in 2035, with policies that include shifting more trips and freight to mass transit. Associated gas recovery is a smaller quantified contribution. The filing identifies 19 associated petroleum gas projects adopted or planned by 2035 that would divert gas away from flaring.
How Power Systems Shape The Targets
South Africa’s 2035 range of 320–380 MtCO₂e follows its 2030 range of 350–420 MtCO₂e. The lower end of the new range is more dependent on international support. Under the country’s accounting rules, emissions from natural disturbances in the land sector, mainly wildfires, are excluded from its assessment against the target. South Africa’s NDC cites 44 gigawatts of new renewable capacity by 2035 under its electricity plan. Grid connections and the pace of coal plant decommissioning will influence how much of that capacity translates into lower emissions.
Namibia expects energy measures to avoid around 5.196 MtCO₂e annually by 2035 in its conditional pathway. Its forest and fire management category accounts for another 10.295 MtCO₂e in that scenario. That puts fire monitoring, land management and reliable estimates of carbon removals alongside renewable power in the delivery programme. The energy and forestry results will need their own evidence because they respond to different policies and physical conditions.
Botswana’s submission identifies a 188 MW committed solar programme in its domestically financed package. It reports investment in two solar independent power projects at Mmadinare and Jwaneng separately from the new conditional financing request. For Egypt, the submission calls for stronger networks and storage to accommodate more variable electricity generation. Tracking when plants connect and how much power they supply would show how quickly each pipeline affects the grid.
Egypt’s electricity plan seeks a 42% share of clean energy in its national electricity mix by 2030. The submission’s use of clean energy covers sources including nuclear power as well as wind and solar. Tracking the mix requires actual generation data, since the capacity of plants on paper and the amount of electricity those plants deliver over a year are different measures.
What Adaptation Spending Could Deliver Locally
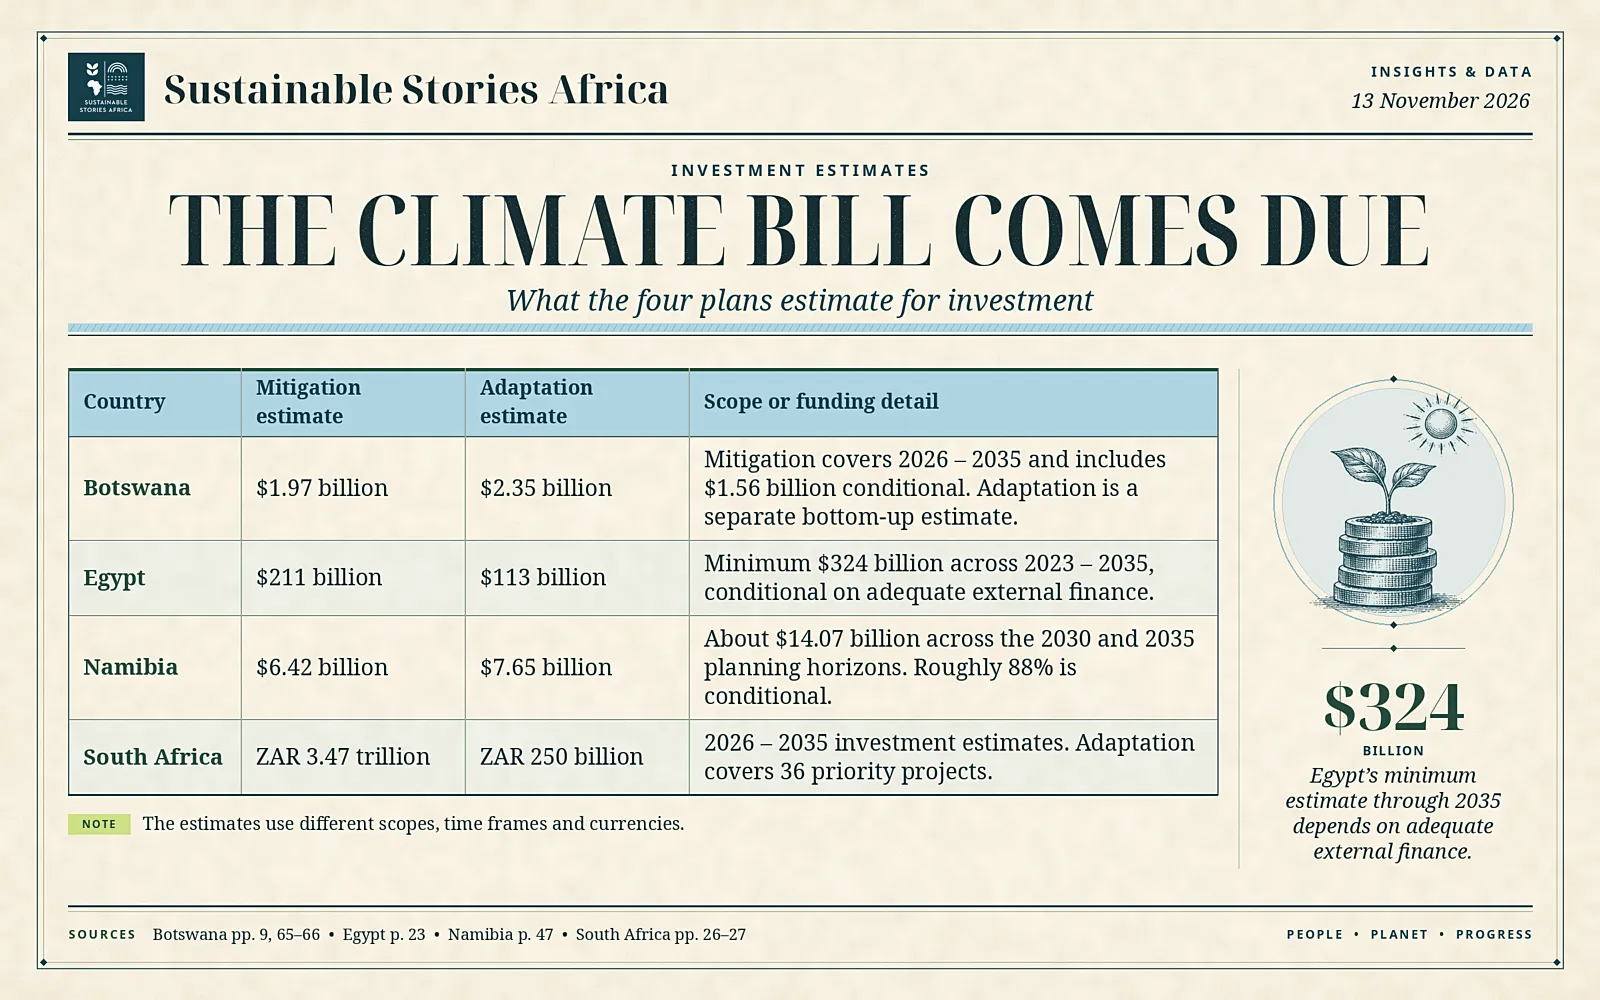
Egypt estimates a minimum of US$113 billion for adaptation within its 2023–2035 costing. Its coastal programme includes site-specific measures in the Northern Delta and Alexandria. The submission envisages improved protection along 20 kilometres of coastline in the Northern Delta by 2035. Measuring the area protected and the people reached would give officials a way to test whether the work is reducing exposure over time.
Namibia sets out a conditional target to rehabilitate and bring at least 1,390 rural water points into operation by 2035 in priority areas. Botswana prioritises drought-tolerant seeds, water security and rangeland management, all of which affect how households fare when rains fail. A repaired borehole and a functioning catchment are outcomes that local authorities can track through dry seasons. Publishing where the work happened would help reveal gaps in coverage.
South Africa puts the cost of 36 priority adaptation projects at ZAR 250 billion for 2026–2035. Water preparedness, climate-resilient infrastructure and support for municipalities feature in the wider plan. When municipalities can prepare projects and secure funding before a disaster, they have a better chance of keeping water and transport services working during an emergency.
Botswana’s bottom-up reassessment puts indicative adaptation needs at US$2.35 billion across six clusters. The plan identifies about US$552 million as secured or in the pipeline. That combined label is important for water and infrastructure agencies deciding when they can commission work. They need to know which funds are available, which projects still await approval and which cost estimates may change before procurement.
What Financing And Delivery Require Next
The estimates cover different activities and time periods. Botswana’s US$1.97 billion refers to mitigation investment over 2026–2035. Egypt’s US$324 billion is a minimum estimate covering mitigation and adaptation from 2023 to 2035, with delivery conditioned on adequate international support. Namibia reports indicative combined costs against its 2030 and 2035 planning horizons. South Africa provides full estimates for mitigation and priority adaptation in rand, alongside a separate goal of accessing US$8 billion a year in international climate finance by 2030.
For utilities and regulators, the immediate delivery questions concern transmission access, procurement and the sequencing of generation projects. In coal-dependent areas, workforce support and local economic diversification need to be planned alongside closures. The wider power transition has a better chance of holding if households can still afford electricity and affected towns can attract replacement investment.
For adaptation, the same discipline belongs in public reporting. Water agencies can publish which facilities are working in drought-prone districts. Municipalities can show which flood and water projects have moved from feasibility studies to funded works. Donors and lenders can identify which projects they have approved, what financing terms apply and how much has reached implementing agencies.
Accounting is equally important after projects enter service. Better fire management can protect carbon stored on the land, and updated inventories can change how much of that carbon the country estimates. Where the target gives land a large role, a published method and a consistent series of observations help readers judge whether reported gains reflect physical changes or revisions to the calculation.
How To Track The Four Plans
Follow power procurement through to grid connection and generation. In Namibia, track forest and fire management alongside the energy figures. In South Africa, watch how finance and worker support shape progress towards the lower end of the range.
For adaptation, follow named works in the Northern Delta, drought-prone districts and high-risk municipalities. The most informative updates will show which facilities operate and which communities they reach.
Headline Options
Sustainable Stories Africa How Botswana, Egypt, Namibia and South Africa Plan to Cut Their Emissions
Bloomberg Four African Climate Plans Tie Power Sector Targets to Major Investment Decisions
Time Magazine What Four African Climate Plans Mean for Workers and Drought-Affected Communities Today
WSJ African Power Plans Face Grid Bottlenecks as Climate Funding Needs Also Rise
Financial Times Four African Economies Outline Four Different Paths to Lower Emissions by 2035
Sources and Data Notes
Botswana NDC 3.0 • PDF pp. 8–10, 24 and 44–47 and 65–66, especially Tables 1 and 33
Egypt NDC 3.0 • PDF pp. 9–12 and 17–23, especially sections 4.1–4.3, 5.3 and 6.4
Namibia NDC 3.0 • PDF pp. 12–13, 35, 47 and 98–100, especially Table 13 and Annex B
South Africa’s Second NDC • PDF pp. 22–27 and 32, especially Tables 2–4
South Africa’s updated first NDC • Table 2, 2030 target range
UNFCCC NDC Registry • Submission dates and titles