South Africa’s second Paris Agreement pledge puts annual emissions between 320 million and 380 million tonnes of carbon dioxide equivalent in 2035.
International support is especially important to reaching the lower end of that range.
The plan links power investment and coal plant closures with workforce support and municipal adaptation.
South Africa Tightens Its Emissions Range
South Africa filed its Second Nationally Determined Contribution on 24 October 2025.
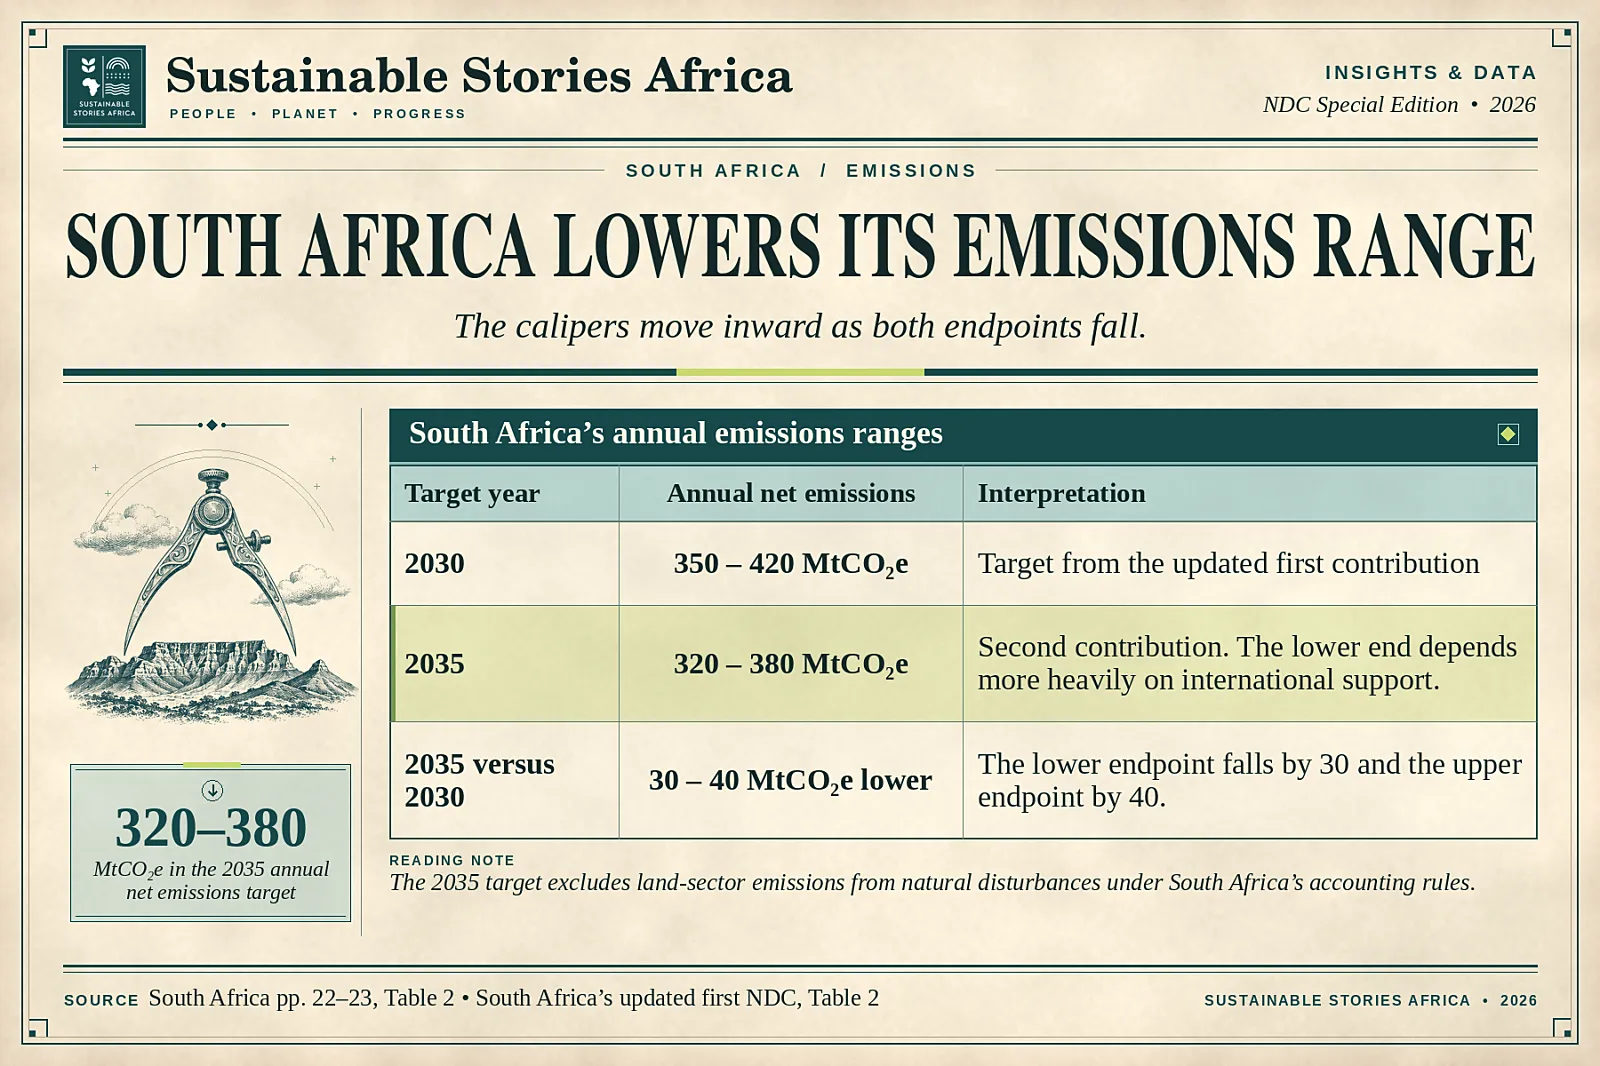
- The active submission covers 2031–2035 and sets annual net greenhouse gas emissions at 320 – 380 million tonnes of carbon dioxide equivalent (MtCO₂e) in 2035 under its accounting rules.
- The 2030 range is 350 – 420 MtCO₂e.
Based on the filing, the lower end of the new range depends especially on the scale of international support.
- Reaching it will also require domestic changes in the power system and other sectors.
- The plan links those changes to the social and economic effects of a transition away from coal.
A nationally determined contribution (NDC) is the climate plan a country communicates under the Paris Agreement.
- The five-year cycle allows countries to set more ambitious objectives and report on implementation.
- South Africa’s range lets readers track annual emissions as investment, energy demand and local conditions evolve.
How To Read South Africa’s Range
The 2035 target is an absolute range for annual net emissions.
Using the same units, this can be compared with the earlier range.
- The upper endpoint falls by 40 MtCO₂e and the lower endpoint by 30 MtCO₂e.
- Those figures describe differences between targets for two years.
South Africa accounts for greenhouse gases across the economy and excludes land-sector emissions from natural disturbances when assessing the target.
- The filing identifies wildfires as the main source of those disturbances.
- Comparing the target with a published inventory requires checking how that inventory treats natural disturbances and whether any adjustments are needed.
The filing relates achievement, especially at the lower end of the range, to the support developed countries provide and mobilise.
- The longer-term transition goal is net zero carbon dioxide by 2050, while the 2035 range covers greenhouse gases in carbon dioxide equivalent.
The range leaves room for different paths between 2030 and 2035.
- Two years with the same emissions at the deadline can follow different sequences of plant closures and new generation.
- Annual inventories and electricity data can show whether cuts occur early or are concentrated near the target year.
- These records also matter for understanding cumulative emissions over the period.
How Power Investment Shapes The Transition
The filing links the power transition to energy access and affordability.
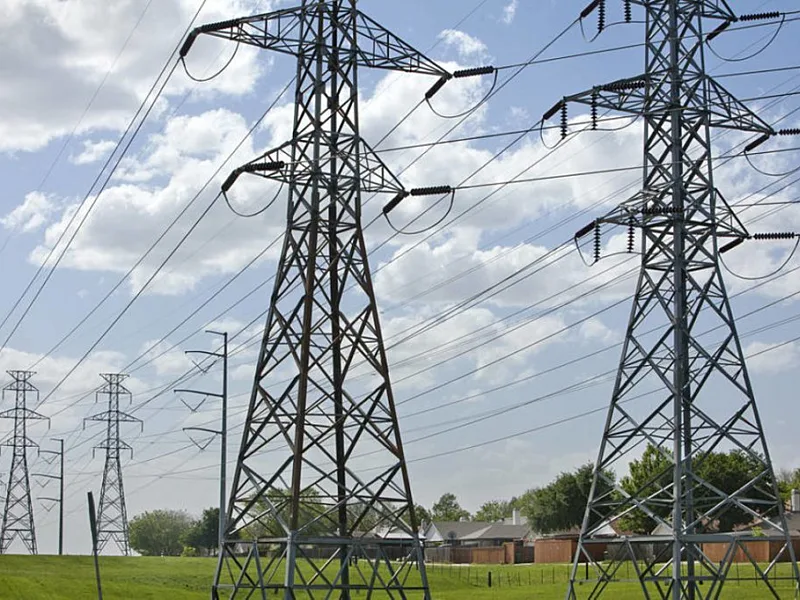
- Transmission projects can connect more capacity, and plant closures change the supply available in different places.
- The order of those decisions can affect reliability.
- Linking investment schedules to information on output, prices and workforce support would provide a fuller view of progress than the capacity figure alone.
South Africa’s filing cites its 2025 electricity plan, which envisages 44 gigawatts of new renewable energy capacity by 2035.
- Transmission capacity, procurement and the timing of grid connections will affect how much that investment changes generation.
- Annual electricity output gives readers another way to assess progress alongside installed capacity.
Coal plant decommissioning is part of the investment identified in the submission.
- Closure timing affects workers, businesses and communities that rely on the plants.
- Plans for training, workforce support and replacement economic activity can be assessed alongside electricity supply and affordability.
- This evidence helps show whether the transition is managing social and economic costs.
The NDC also identifies potential for domestic production in renewable energy and storage value chains.
- Local industrial development depends on investment, skills and demand for components.
- Procurement and employment records can show whether those opportunities are reaching the places most affected by shifts in power generation.
Where Adaptation Investment Can Protect Services
The plan treats loss and damage as part of the response to climate risk and identifies a role for national, provincial and municipal disaster management institutions.
- Preparedness, emergency response and recovery have different budgets and timelines.
- A local authority can use records of damages and service interruptions to guide which risks it prepares for and what support it needs.
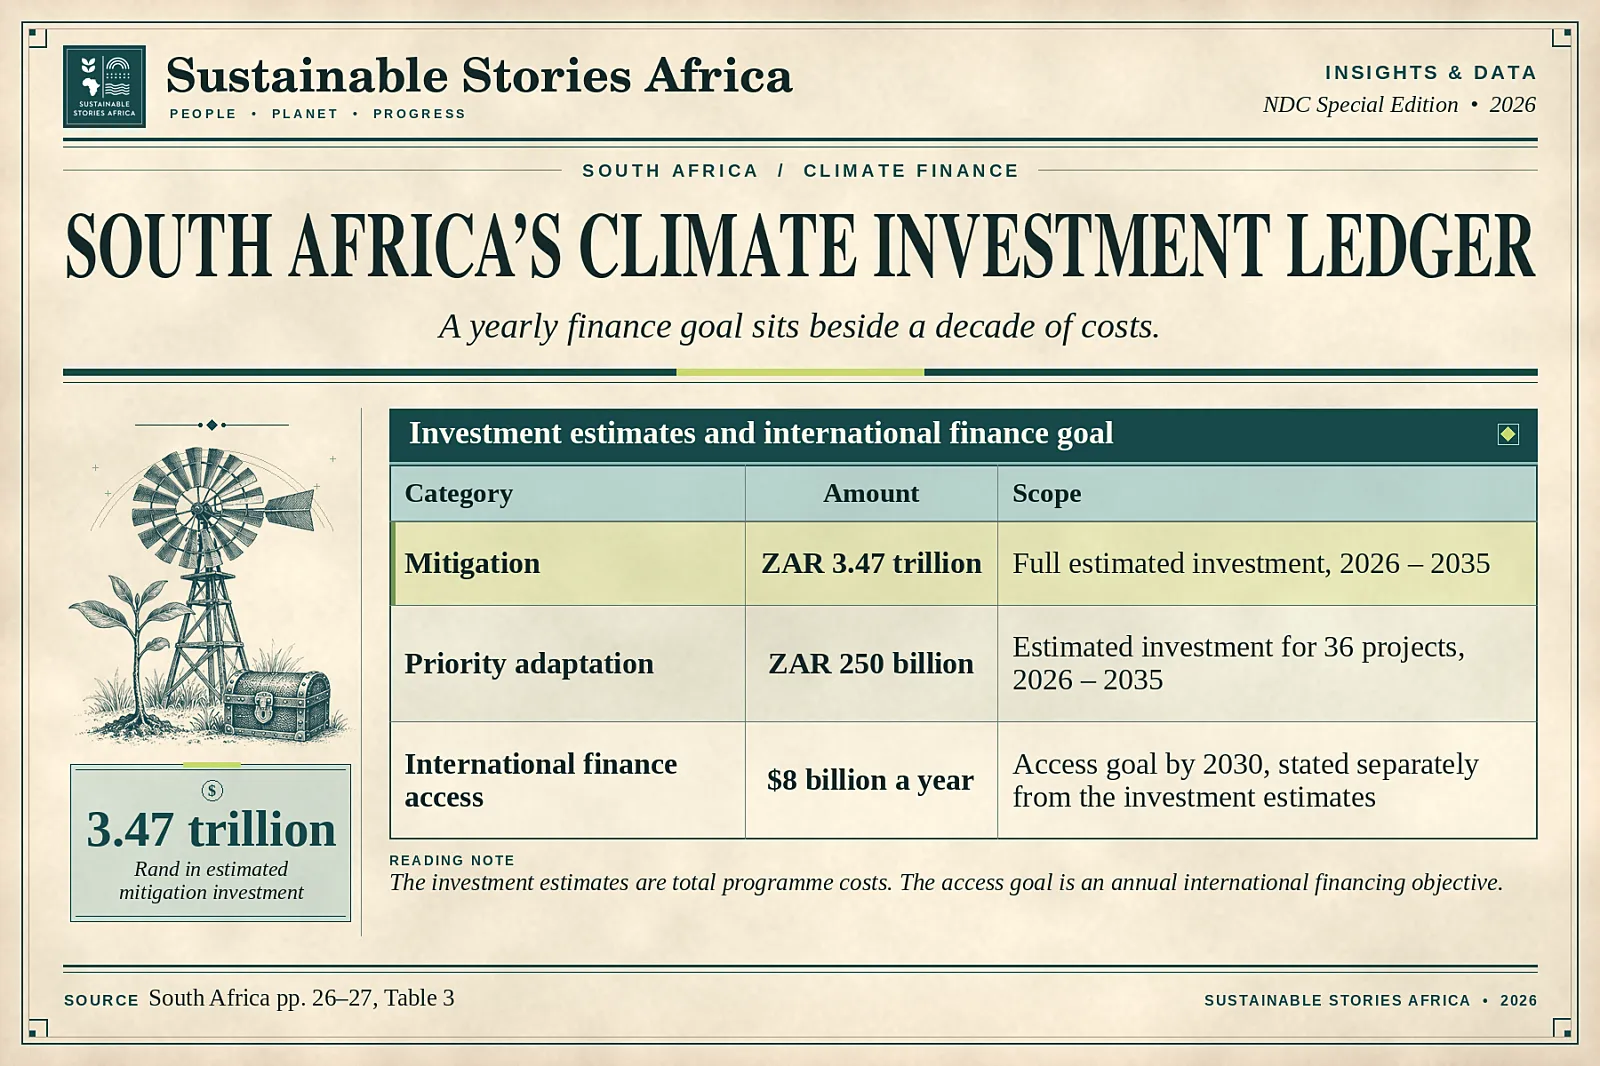
South Africa estimates ZAR 250 billion for 36 priority adaptation projects over 2026 – 2035.
- The estimate covers a set of selected investments.
- The filing discusses wider adaptation needs and includes priorities such as municipal water preparedness, resilient infrastructure and better access to finance for local governments.
A water-stressed municipality can use improved monitoring and preparedness plans to identify shortages sooner.
- Water reuse and managed aquifer projects can improve supply reliability where local conditions allow.
- Tracking service availability during drought or flooding would help officials assess the benefit to residents.
Climate impacts are uneven across provinces and municipalities
- Local risk and service data can show where losses are concentrated.
Financing project preparation can also help municipalities turn those findings into procurement-ready plans.
A funded project with clear responsibilities gives residents a way to follow progress from design through operation.
The contribution identifies the Climate Change Response Fund as one part of its institutional response.
- In the loss and damage section, it also points to the international Fund for Responding to Loss and Damage.
- These arrangements address different parts of financing and coordination.
- Reporting which agencies receive and spend funds would help readers follow how each arrangement supports emergency readiness, recovery or longer-term adaptation.
What Funding And Delivery Can Show
The investment estimates cover activities with a range of funding sources and purposes.
- The mitigation total includes investments that may be needed across more than one emissions pathway.
- The adaptation figure applies to a selected set of projects.
- Separating expenditure by programme and funding instrument would help readers interpret what is covered when new financing is announced.
South Africa estimates ZAR 3.47 trillion for mitigation over 2026 – 2035, including investments such as infrastructure upgrades, decommissioning and workforce support.
- The figure is an overall investment estimate.
- The filing separately maintains the goal of accessing $8 billion a year in international climate finance by 2030.
The country envisages a financing strategy that links investment needs, funding sources and implementation.
- It also plans to track access to adaptation finance and identify which instruments are used.
- This matters because grants, equity investment and loans create different obligations for government and implementing organisations.
Biennial Transparency Reports and domestic systems can help connect the target range with measured emissions and support received.
- They can also explain changes in land-sector accounting.
- Utilities and municipalities can provide evidence on actual power generation, workforce measures and adaptation projects, giving the national reporting a clearer account of how the transition is proceeding.
South Africa envisages reporting support received and tracking outcomes through national and local systems.
- Consistent municipal data can show where water preparedness or flood resilience has improved.
- Power-sector and employment data can add detail on the transition.
- Using comparable reporting periods allows ministries to assess whether falling emissions coincide with reliable service and support for affected communities.
The NDC cites South Africa’s first Biennial Transparency Report, which recorded $827.69 million in international financial support over 2021 – 2022 and described loans as about 80% of that amount.
- These are figures for support reported during a particular period.
- The 2030 access goal and the 2026 – 2035 investment estimate serve different purposes and need their own reporting lines.
Path Forward – What To Watch As Investment Proceeds
Check annual emissions against the target range and track renewable generation, grid connections and support for workers in coal-dependent communities.
For adaptation, look for financing and completed works at municipal levels.
Water services that continue through drought or floods can show how investment is reducing risk.