Nigeria plans to cut annual greenhouse gas emissions by 184.9 million tonnes of carbon dioxide equivalent by 2035 against its revised 2018 inventory.
The pledge changes how the country measures progress under the Paris Agreement.
Its $337 billion estimate includes work to curb emissions, prepare for climate hazards and expand public participation.
Nigeria Adopts A Historical Emissions Baseline
Nigeria filed its third nationally determined contribution on 22 September 2025.
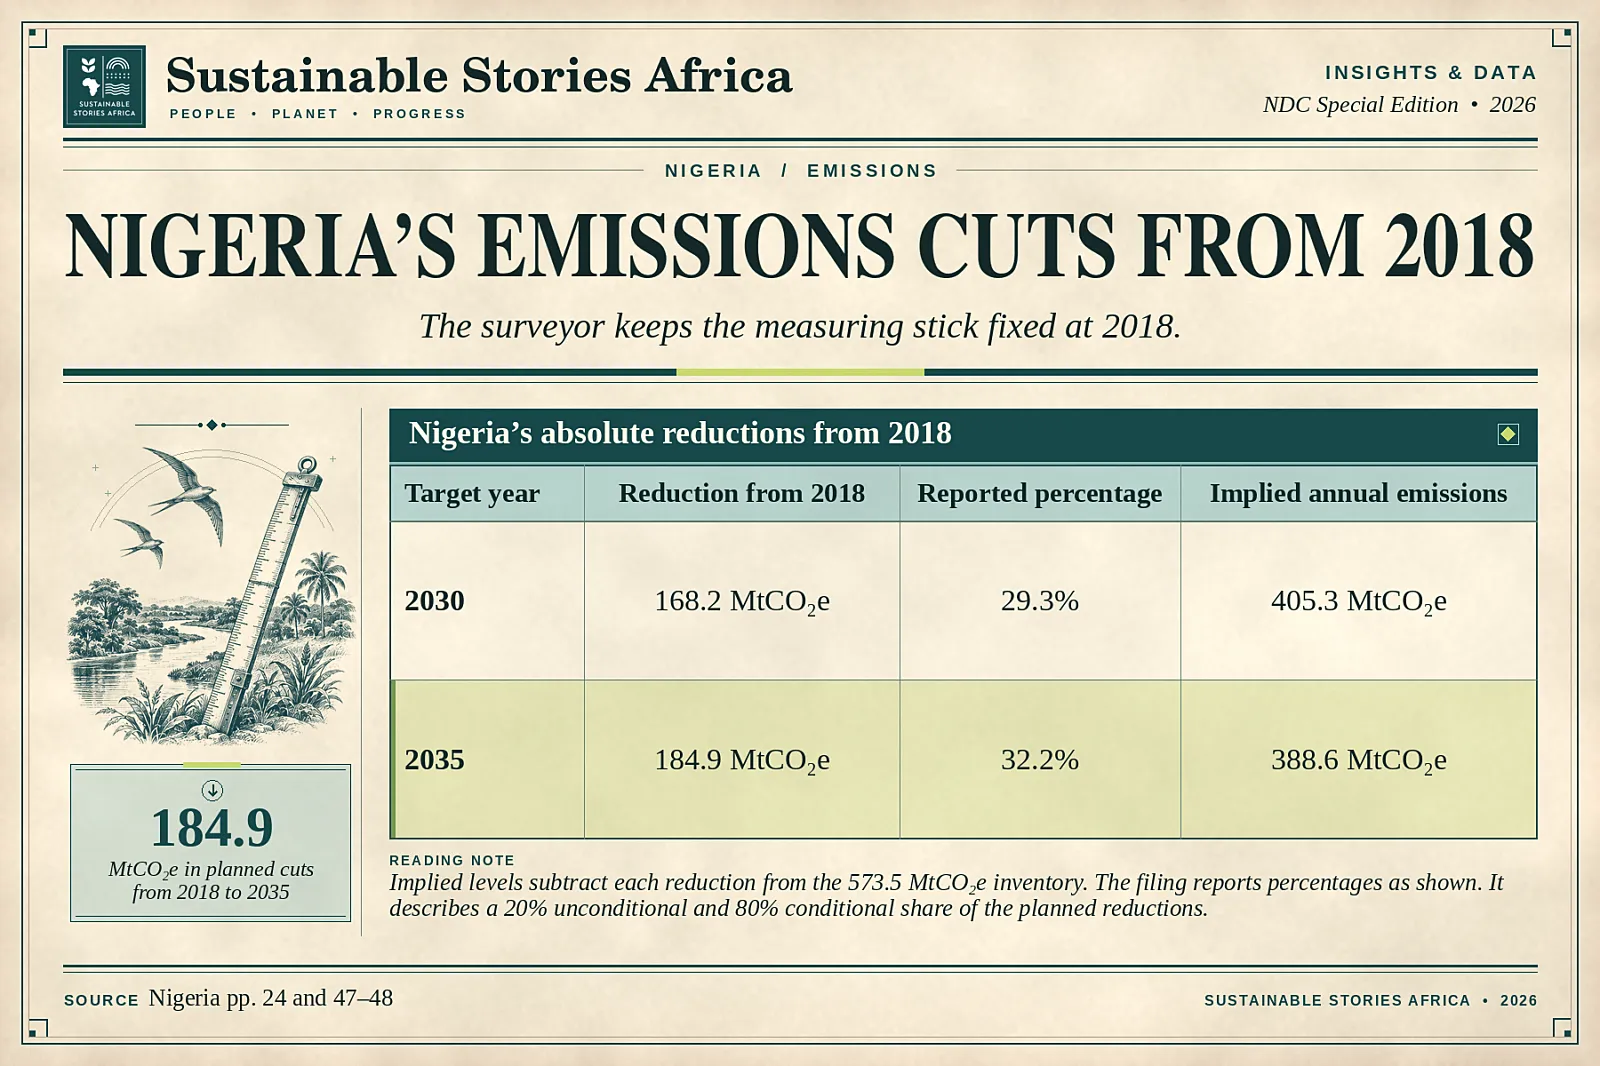
- The active submission sets a 2035 reduction of 184.9 million tonnes of carbon dioxide equivalent (MtCO₂e) against a revised 2018 inventory of 573.5 MtCO₂e.
- Nigeria reports the reduction as 32.2%.
- Its stated figures imply a 2035 emissions level of 388.6 MtCO₂e.
The plan replaces Nigeria’s previous approach, which measured reductions against projected future emissions.
- The historical baseline provides a fixed reference for successive reports, subject to transparent inventory revisions.
- The filing also sets a 2030 reduction from the same reference year and relates both targets to its long-term net zero goal for 2060.
A nationally determined contribution (NDC) is a climate plan communicated under the Paris Agreement.
- The five-year cycle allows countries to update their goals and how they measure them.
- For Nigeria, the target sits alongside measures that matter to operators in the oil and gas sector and farmers exposed to floods and changing rainfall.
How Nigeria Calculates The National Target
Nigeria’s stated 2030 reduction is 168.2 MtCO₂e, or 29.3% below the revised 2018 inventory.
- Subtracting this cut from the baseline implies annual emissions of 405.3 MtCO₂e in 2030.
- Both the 2030 and 2035 numbers are annual points on the proposed pathway.
Nigeria describes an unconditional share of 20% and a conditional share of 80% of the planned reductions.
- The denominators matter.
- A share of the planned cut describes how much of the reduction depends on support.
- A percentage below the baseline describes the change in annual emissions relative to the inventory.
The filing also explains that Nigeria has revised its 2018 estimate over time as its inventory methods and underlying data changed.
- Comparing the earlier and current pledges requires attention to both the reference used in each version and the gases and activities included in each inventory.
The filing explains why revising a baseline matters.
- Nigeria’s 2021 contribution had used a 2018 estimate of 347 MtCO₂e.
- Its first Biennial Transparency Report revised that estimate to 614 MtCO₂e, and the new submission uses 573.5 MtCO₂e after further updates to data and methods.
- These values represent different estimates for the same year, so comparisons should identify the inventory version used.
Where Nigeria Can Reduce Emissions Early
The oil and gas measures give a more immediate milestone for leaks and venting.
- The filing identifies a 60% reduction by 2035 for those sources under the sector programme.
- Regular site monitoring and enforcement can show whether the measures are being put into practice.
- Reporting both categories separately would make it easier to see what is changing at production facilities.
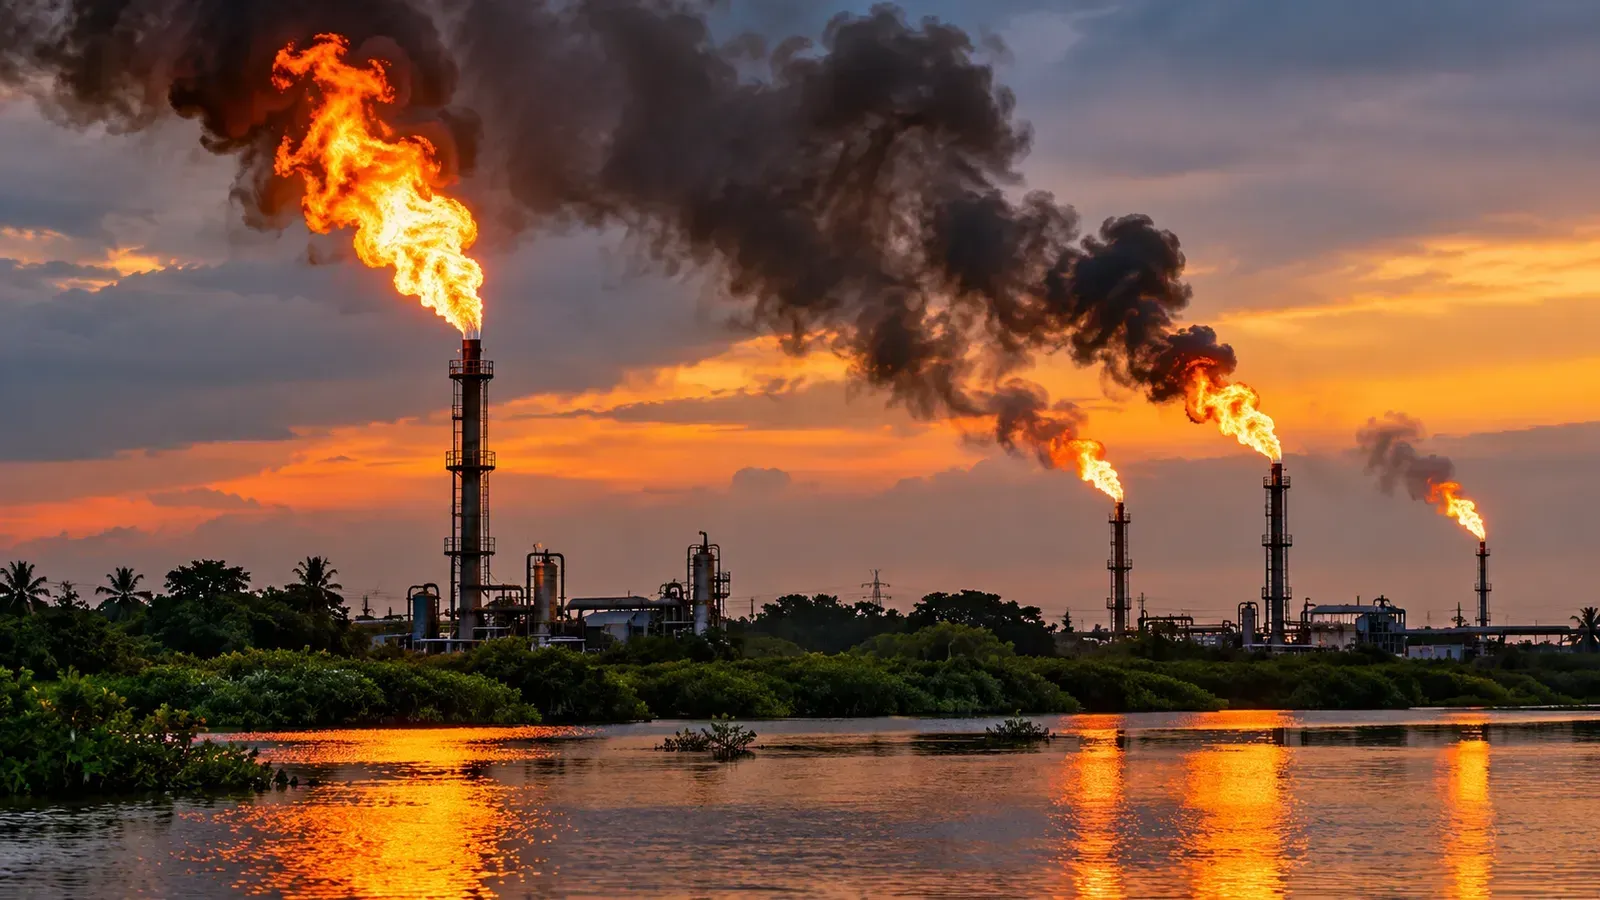
Nigeria aims to eliminate routine gas flaring by 2030.
- Gas capture, utilisation and improved operating practices can help reduce the amount burned at production sites.
- Reporting volumes and explaining how operators distinguish routine flaring from other flaring would give readers a way to track progress toward the pledge before 2035.
The contribution identifies methane from oil and gas leaks as a separate issue.
- Measuring leaks requires different evidence from measuring flaring, even when both come from the same facility.
- Inspection results and repair records can help regulators assess whether reported cuts reflect operational changes and whether those changes persist.
The wider mitigation portfolio also covers power, transport, industry, agriculture, land use and waste.
- Investment in cleaner generation and more reliable electricity can help users shift away from higher-emitting sources where access and service improve.
- Sector inventories can show where the cuts are occurring and where measures still need support.
How Adaptation Can Reach Farming Communities
The filing sets out related priorities for storage, processing and reducing food losses.
- Timely access to forecasts can guide decisions before harvest.
- Storage and local services can protect the value of what farmers have already produced.
- State records can help establish whether farmers can access services when needed and how the benefits vary across places and seasons.
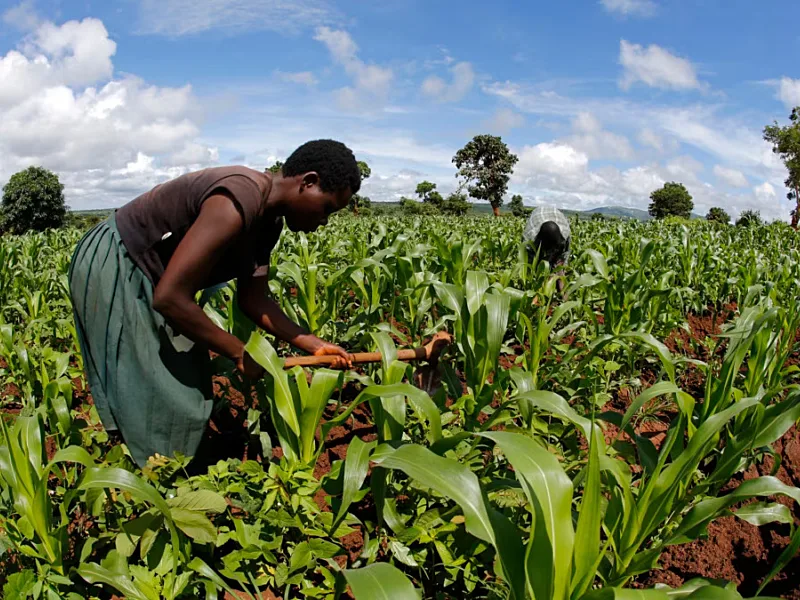
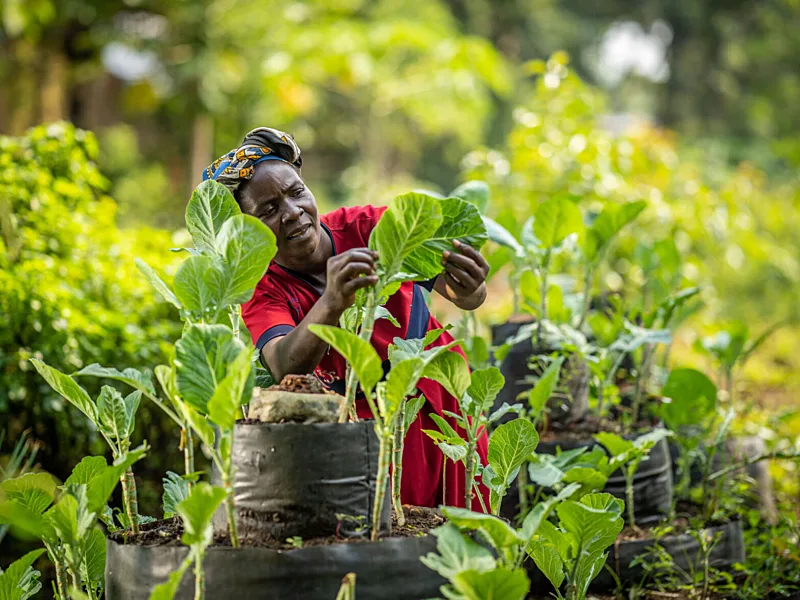
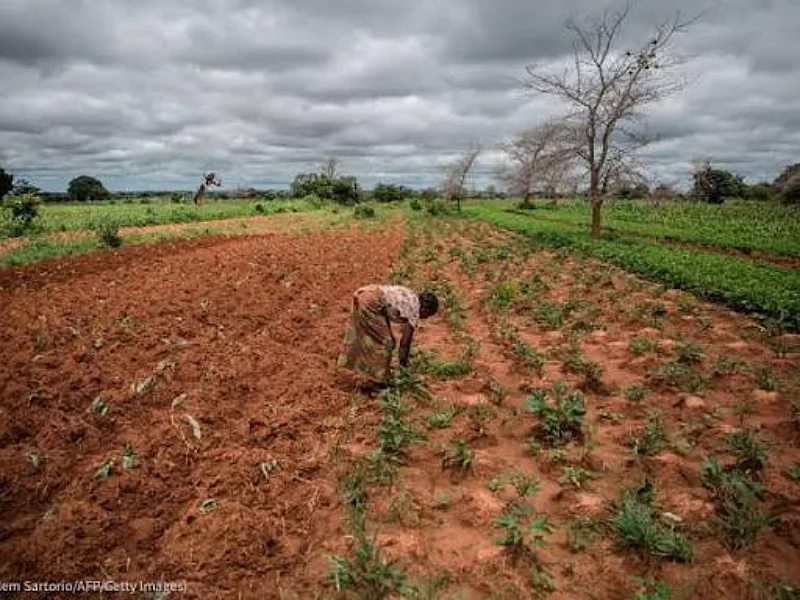
Nigeria’s adaptation measures include rolling out early warnings and agricultural meteorological forecasts in 18 states.
- The submission also calls for stronger extension services in 18 states and support for climate-resilient farming.
- Useful warnings need to arrive before decisions about planting, harvesting or moving livestock.
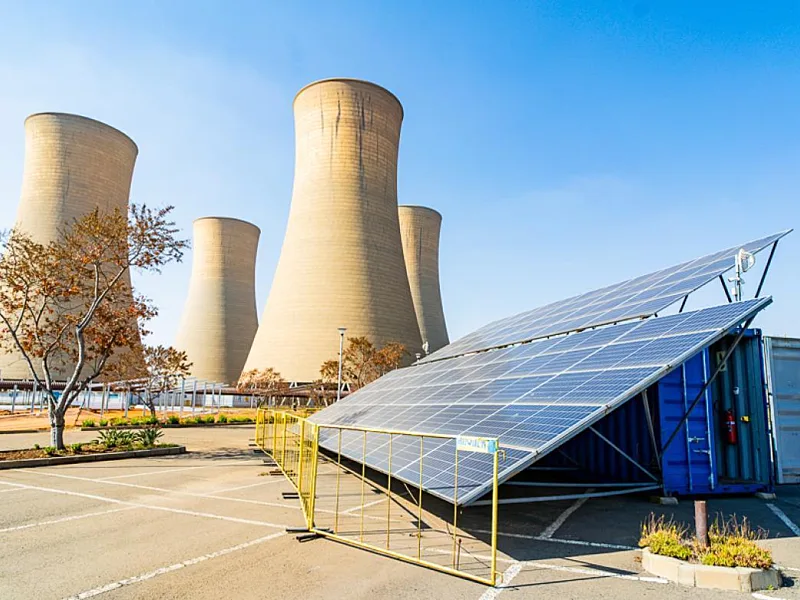
The plan describes investments in irrigation and proposes shifting some systems from fossil-fuel power to solar.
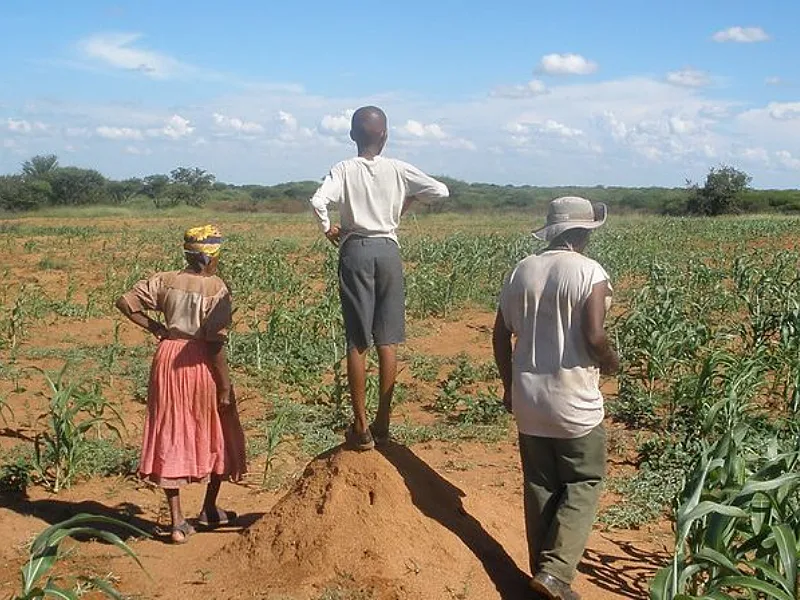
- More reliable irrigation can reduce exposure to erratic rainfall.
- An irrigation service also needs a dependable water source, functioning pumps and local arrangements to maintain them.
- These are measurable outcomes for agencies that fund and run the schemes.
Nigeria includes Action for Climate Empowerment in its costing.
- The category covers public education, awareness and participation.
- Keeping it visible in the budget can help readers see what the plan allocates to public engagement alongside infrastructure and technical interventions.
Nigeria’s filing says its adaptation actions reflect sector policies and a national climate risk assessment.
- It also describes plans for a National Adaptation Plan.
- Tracking services by state would show how those national priorities translate into decisions on extension, preparedness and water.
- The same information can help identify places where risks are growing faster than investment.
What Financing And Reporting Can Show
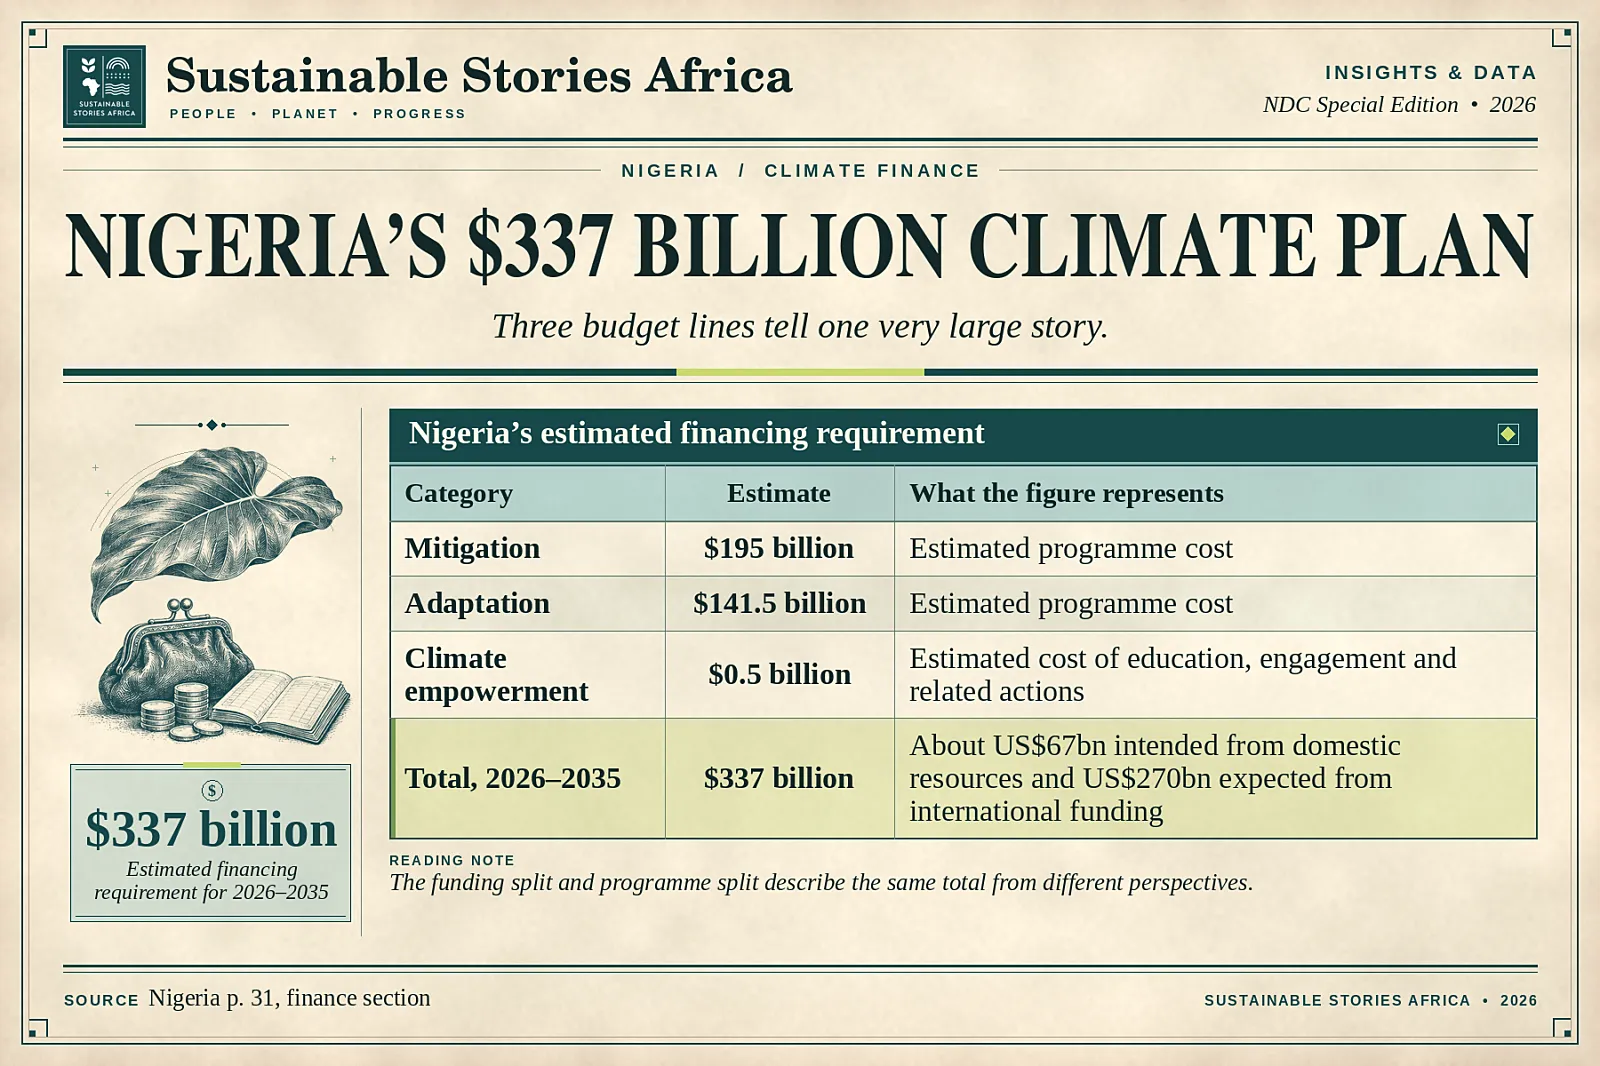
Mitigation accounts for about $195 billion of the estimate and adaptation for about $141.5 billion.
- Climate empowerment adds a further $500 million.
- Showing those figures together helps explain what the headline total covers.
- How each item is financed will influence procurement, ongoing costs and how quickly projects reach communities or industrial facilities.
Nigeria estimates that it needs $337 billion from 2026 to 2035.
- It aims to mobilise about $67 billion domestically and expects about $270 billion in international funding.
- The filing discusses potential proceeds from internationally transferred mitigation outcomes as one possible source for the domestic component once the mechanism is operational.
The country envisages an implementation strategy and action plan followed by an investment plan.
- These documents can identify responsible institutions, financing terms and the project sequencing.
- For a project funded partly through carbon markets, the public accounts can also show how transfers are treated under Article 6 and which reductions count towards Nigeria’s pledge.
Future greenhouse gas inventories and Biennial Transparency Reports can show whether annual emissions are falling against the 2018 reference and explain any subsequent recalculation.
- State and sector records add detail about operations. Examples include verified flaring volumes, the reach of warnings and how consistently local water projects remain in service.
Both domestic and international mobilisation need records that distinguish expected financing from funds already available.
- A loan agreement, a budget allocation and a disbursement occur at different stages.
- The same reporting discipline applies to measured emissions outcomes
- Linking these records would help readers see when new funding changes operations and when the national inventory begins to reflect them.
For energy agencies and operators, early reporting can show whether measures are reducing methane from leaks and venting alongside the decline in routine flaring.
- A national inventory can reflect these improvements over time.
- Site evidence helps link sector figures, specific equipment, operating changes and enforcement decisions, informing where further investment is needed.
Path Forward – What To Watch Before The Deadline
Follow reported flaring volumes, power investments and progress against the 2030 and 2035 emissions levels implied by the submission.
Compare financing raised with the stated domestic and international amounts.
At the state level, track the reach of timely agricultural warnings and the reliability of new irrigation services.