Chika Onyekwere’s ESG for Manufacturers: A Beginner’s Guide: Part 2 argues that African factories can no longer treat carbon accounting as a side exercise.
The numbers now reach far beyond boilers, generators and plant gates.
From Ogun State to wider African industrial markets, the greater risk lies in the value chain: purchased inputs, logistics, packaging and product end-of-life.
That is where competitiveness, compliance and future market access are increasingly being decided.
Carbon accounting reaches the factory floor
For African manufacturers, the most important ESG lesson in Part 2 is also the most disruptive: the emissions a company does not directly control can still dominate its total footprint.
Chika Onyekwere’s guide makes that point in plain language, breaking manufacturing emissions into Scope 1, Scope 2 and Scope 3 under the GHG Protocol, then showing why Scope 3 is often the real strategic battleground.
The document is especially relevant for Nigerian and African producers facing energy insecurity, rising buyer scrutiny and tougher disclosure expectations.
Its Ogun State case study, NutriPackN Foods Limited, shows a food processor with a baseline footprint of 4,847 tonnes CO₂e per year, a 30% reduction target by 2028, required investment of N58.5 million, annual cost savings of N42.8 million and a payback period of just 1.4 years.
That framing matters because it turns ESG from abstract reporting into operating math. It asks factory managers, boards, financiers and regulators a harder question: if most emissions sit outside the fence line, are companies measuring the right risks at all?
The metric that changes the story
The most arresting insight in the guide is simple: a manufacturer can cut its own emissions by 50% and still affect only a fraction of its total footprint if Scope 3 dominates.
Onyekwere illustrates this with an aluminium can example where Scope 1 and 2 together account for just 20% of total emissions, while upstream aluminium production alone contributes 70% and downstream activity adds another 10%.
That is why Part 2 pushes African manufacturers beyond traditional factory-only accounting.
- Scope 1 covers direct on-site emissions such as stationary combustion, process emissions, refrigerant leaks and company vehicles.
- Scope 2 covers purchased electricity.
- Scope 3 spans the full value chain, from purchased goods and transport to end-of-life treatment, franchises and investments.
What the numbers reveal for African manufacturing
The Ogun State case study grounds the issue in a recognisable Nigerian operating environment
NutriPackN Foods, a food processing and packaging company established in 2015, employs 180 staff, generates annual revenue of N850 million, produces 3,600 tonnes of finished products a year and runs two shifts over 300 operating days.
Its energy mix is also familiar: 55% grid electricity, 35% diesel generators and 10% LPG, with weekly power outages of eight to 12 hours.
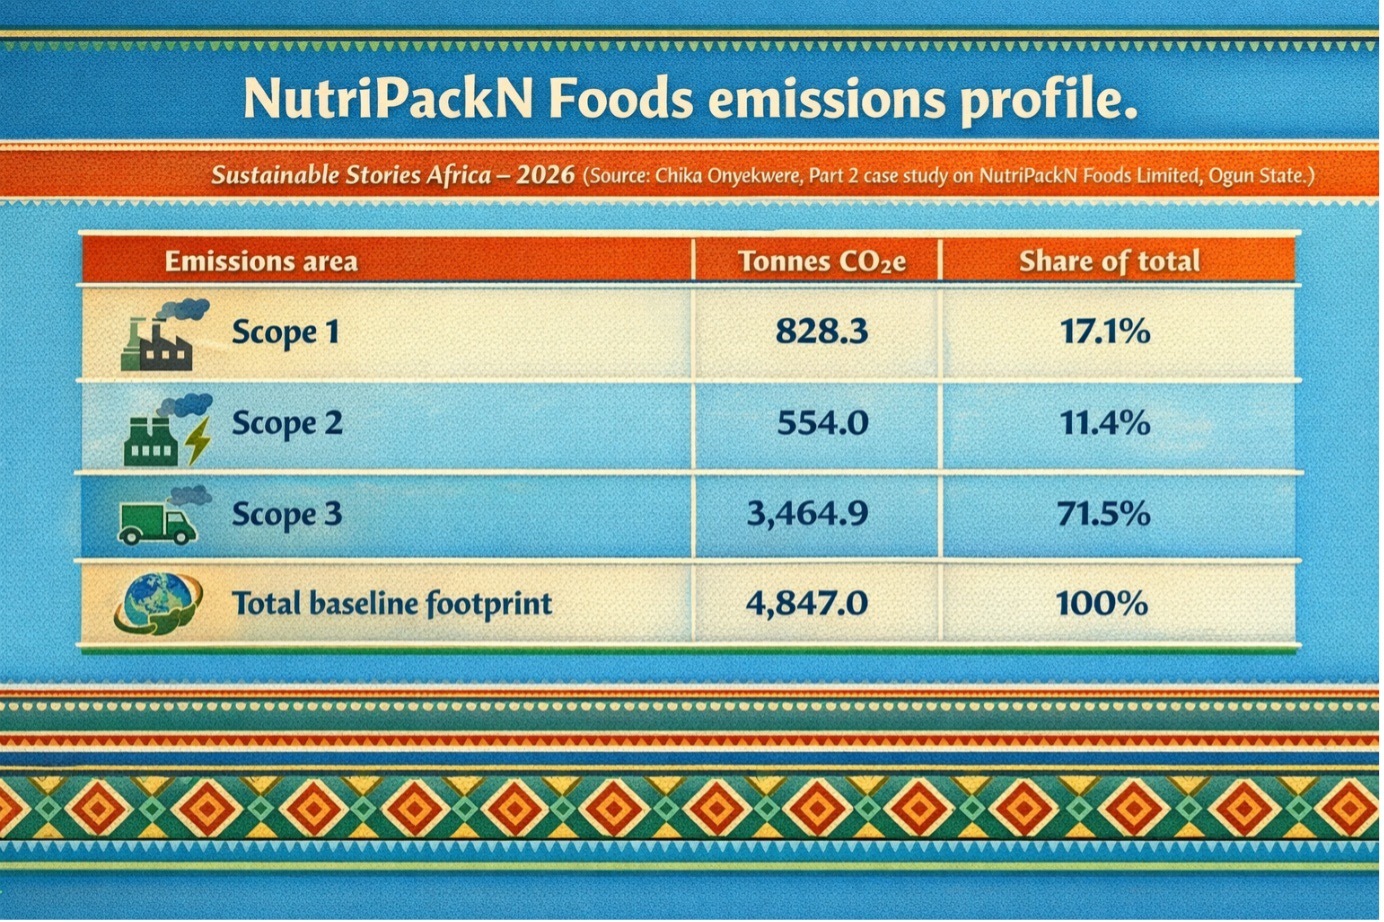
Its emissions profile shows why direct emissions are only part of the story.
- Scope 1 totals 828.3 tonnes CO₂e, or 17.1% of the overall footprint. Within that, stationary combustion contributes 615.9 tonnes, mobile combustion 62.1 tonnes, and fugitive emissions 150.3 tonnes, driven largely by refrigerant leakage from R-404A cold storage systems.
- Scope 2 adds 554.0 tonnes CO₂e, or 11.4% of the total, based on 1,000,000 kWh of purchased grid electricity and a Nigerian grid emission factor of 0.554 kg CO₂e per kWh.
- Scope 3 is where the full burden appears. The guide estimates 3,464.9 tonnes CO₂e in Scope 3, equal to 71.5% of NutriPackN’s total footprint. That single number changes the management agenda. It means procurement, supplier selection, materials, logistics and packaging decisions matter more than many firms assume.
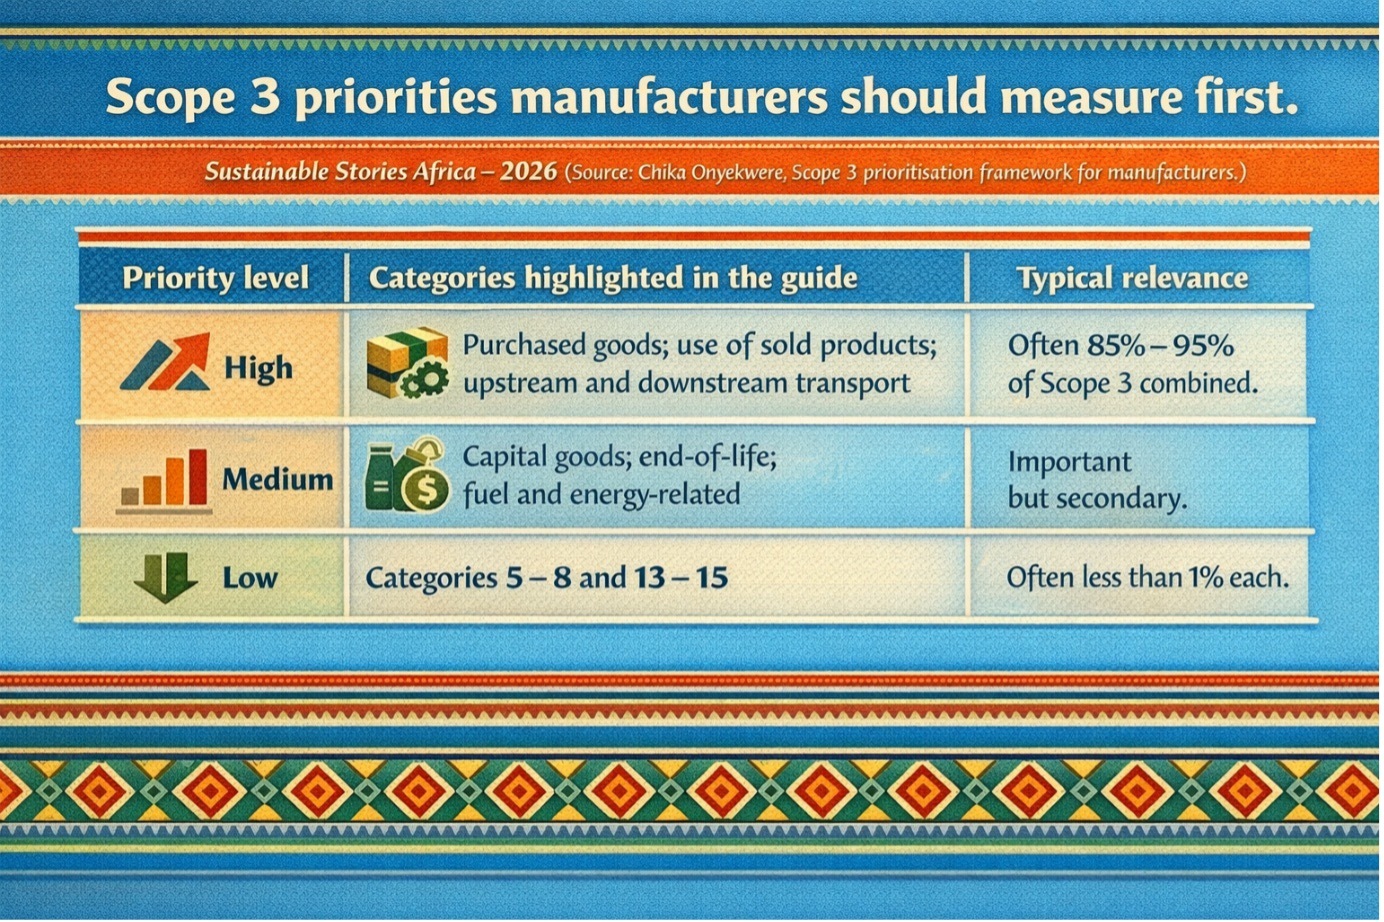
The guide shows where manufacturers should focus first: the few categories that drive most Scope 3 emissions. Purchased goods, transport and, where relevant, the use of sold products dominate the footprint. Its message is simple: measure the biggest sources first, because Categories 1, 11, 4 and 9 can explain most total emissions.
In the NutriPackN example, Category 1 purchased goods and services alone, total 2,324 tonnes of CO2e, driven by wheat flour, palm oil, maize and plastic packaging.
The guide also tracks emissions from transport, fuel and energy use, waste, commuting, business travel and end-of-life treatment, showing how routine inputs and logistics contribute substantially to the footprint.
Part 2 explains the accounting in plain language.
- Scope 1 Is the fire a company that lights itself?
- Scope 2 is purchased electricity
- Scope 3 covers everything before materials arrive and after products leave.
That framing makes a technical reporting system easier for African manufacturers still building ESG capacity.
What better carbon discipline can unlock?
The guide does not present measurement as a bureaucratic burden. It presents it as a route to stronger margins and more resilient operations.
In NutriPackN’s case, the proposed transition delivers improved energy security, regulatory compliance and enhanced market access.
Part 2 also points to practical gains. Scope 2 often accounts for 30% – 60% of a manufacturing footprint and is usually the easiest to measure.
The guide’s Lagos solar example shows a 100-kW installation costing N25 million, producing annual electricity savings of N5 million, cutting emissions by 60 tonnes CO₂e and paying back in five years, delivering effectively free electricity for more than two decades.
Scope 3 creates an even larger upside. Recycled aluminium can cut emissions by 95% compared with virgin material, recycled plastic by 70%, and local sourcing cuts transport emissions.
Lighter, more durable and more recyclable product design can also shrink downstream exposure. For African manufacturers, that means a good ESG strategy is increasingly a good industrial strategy.
What African manufacturers should do next?
- First, adopt a formal accounting boundary and methodology. Onyekwere’s case study applies the GHG Protocol Corporate Accounting and Reporting Standard, ISO 14064-1:2018 and IPCC inventory guidelines using an operational-control boundary, covering CO₂, CH₄, N₂O and HFCs.
That is the kind of discipline firms will need as buyer and regulatory expectations harden.
- Second, start where the emissions are largest, not where reporting is easiest. Measure purchased goods, transport, packaging and end-of-life early. Ask top suppliers for emissions data. Reassess high-impact materials such as palm oil and virgin plastics. Design products and packaging to reduce transport weight and make recycling easier.
- Third, treat energy reliability as both a climate and competitiveness issue. Nigerian manufacturers that deal with outages and diesel dependence should combine efficiency upgrades with cleaner power options, including rooftop solar, efficient motors, insulation and other fast-payback measures.
Path Forward- Measure value chains before markets do
Part 2 makes the next step clear for African manufacturers: move from factory-only emissions tracking to full value-chain accounting, beginning with purchased goods, transport, packaging and electricity.
The promise is as much commercial as environmental. Firms that price carbon into procurement, design and energy strategy earlier will be better positioned for compliance, capital access and export resilience before Part 3 turns to the next layer of ESG execution.
ESG in Manufacturing Industry Part 2