Record October heat sharpens adaptation priorities
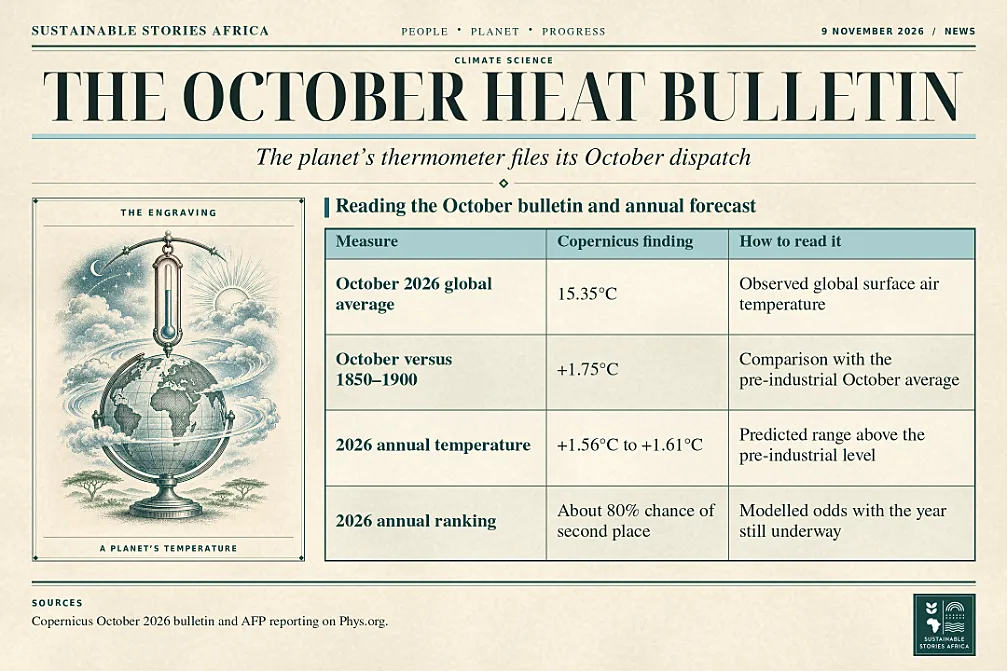
Copernicus puts the chance that 2026 ranks second for global warmth at about 80%.
An unusually strong El Niño has added to human-caused warming.
The outlook gives planners another reason to prepare for sustained heat.
Record October sets the annual outlook
The Copernicus Climate Change Service says 2026 is most likely to finish as the second-hottest year on record after the world recorded its warmest October.
- The European Union’s climate monitor puts the probability of a second-place finish at around 80%, with a 20% chance that 2026 ties or exceeds the record set in 2024.
Its statistical projection places the annual global temperature between 1.56°C and 1.61°C above pre-industrial levels.
October averaged 15.35°C globally, or 1.75°C above the estimated average for the same month in 1850 – 1900.
It was the third consecutive month to exceed 1.5°C on that comparison.
Report findings, according to AFP on 6 November, arrived ahead of the UN climate conference in Antalya, Türkiye, where governments face questions over the pace of emissions cuts and support for adaptation.
El Niño adds heat to the system
Copernicus reported a record monthly sea surface temperature of 29.94°C in the Niño 3.4 region, a section of the tropical Pacific used to monitor El Niño.
- Warming there can alter rainfall and temperature patterns far beyond the Pacific.
- Samantha Burgess, climate strategy lead at the European Centre for Medium-Range Weather Forecasts, attributed the exceptional warmth to a strong El Niño acting on a climate already warmed by human activity.
The ocean signal matters to African forecasters because El Niño can change the seasonal odds of rainfall and heat.
- The timing, direction and intensity of those effects depend on location and other climate conditions.
- A global bulletin gives national services a starting point.
- Regional and local forecasts tell a grower whether to expect a different planting window or a reservoir operator whether to revisit water allocations.
The bulletin reports two ways of expressing the October anomaly.
- Compared with the more recent 1991 – 2020 average for the month, October was 0.90°C warmer.
- Compared with the earlier baseline, it was 1.75°C warmer.
- Both figures describe the same month.
The reference period matters especially when a chart appears alongside a long-term climate target or when agencies compare bulletins built using different conventions.
Put different temperature measures to work
Copernicus expects the average for 2023 – 2026 to exceed 1.5°C above pre-industrial levels.
- The Paris Agreement’s temperature goal addresses long-term global warming.
- A month, a year and a four-year average cover different periods, even when measured against the same baseline.
Keeping those distinctions visible helps readers see what the new numbers establish and why the direction of change matters.
For a city health department, the local variables are more immediate.
- The number of hot nights affects how much residents can recover between hot days.
- A run of extreme afternoons may raise demand for cooling while clinics and water suppliers also need reliable power.
Seasonal forecasts can give these services time to prepare, especially in areas where households have limited access to cooling.
Turn seasonal information into decisions
Municipal agencies can use forecasts to decide when to extend clinic staffing, activate heat alerts or support outdoor workers with breaks and water.
Farm extension services can combine seasonal outlooks with local rain and soil information to advise on planting and water use.
- Time matters when agencies agree in advance who acts, which threshold triggers a response and how the information reaches people who need it.
Climate negotiators face a separate timescale.
- Finance for early warning, reliable power and public health can help communities manage near-term risk.
- Cuts in greenhouse gas emissions influence the longer-term warming trend on which temporary El Niño peaks are superimposed.
The October bulletin offers a common set of figures for those conversations, with the final annual ranking due once the year’s observations are complete.
The probabilities also answer a narrower question than the temperature projection.
- The ranking depends on how the annual average compares with 2024 and other years in the record.
- The predicted range describes the difference from the pre-industrial baseline.
- Two years can end close in temperature and still rank differently.
For planners preparing for unusually warm conditions, that small ranking difference may matter less than the heat levels local services could face.
Path Forward – Link climate forecasts to local action
National weather services can translate the global outlook into seasonal guidance for districts, farmers and electricity operators.
Public agencies can then report which measures they activate when local thresholds are reached.
The final 2026 ranking will sharpen the global record.
The local tests are whether warnings arrive in time and whether communities can act on them.
Culled from: 2026 'most likely' to be second-hottest year on record: EU monitor