Fossil fuel importers paid an estimated $330 billion more for seaborne fuels in March to August than pre-war futures prices implied, with Africa having a net loss of $300 million.
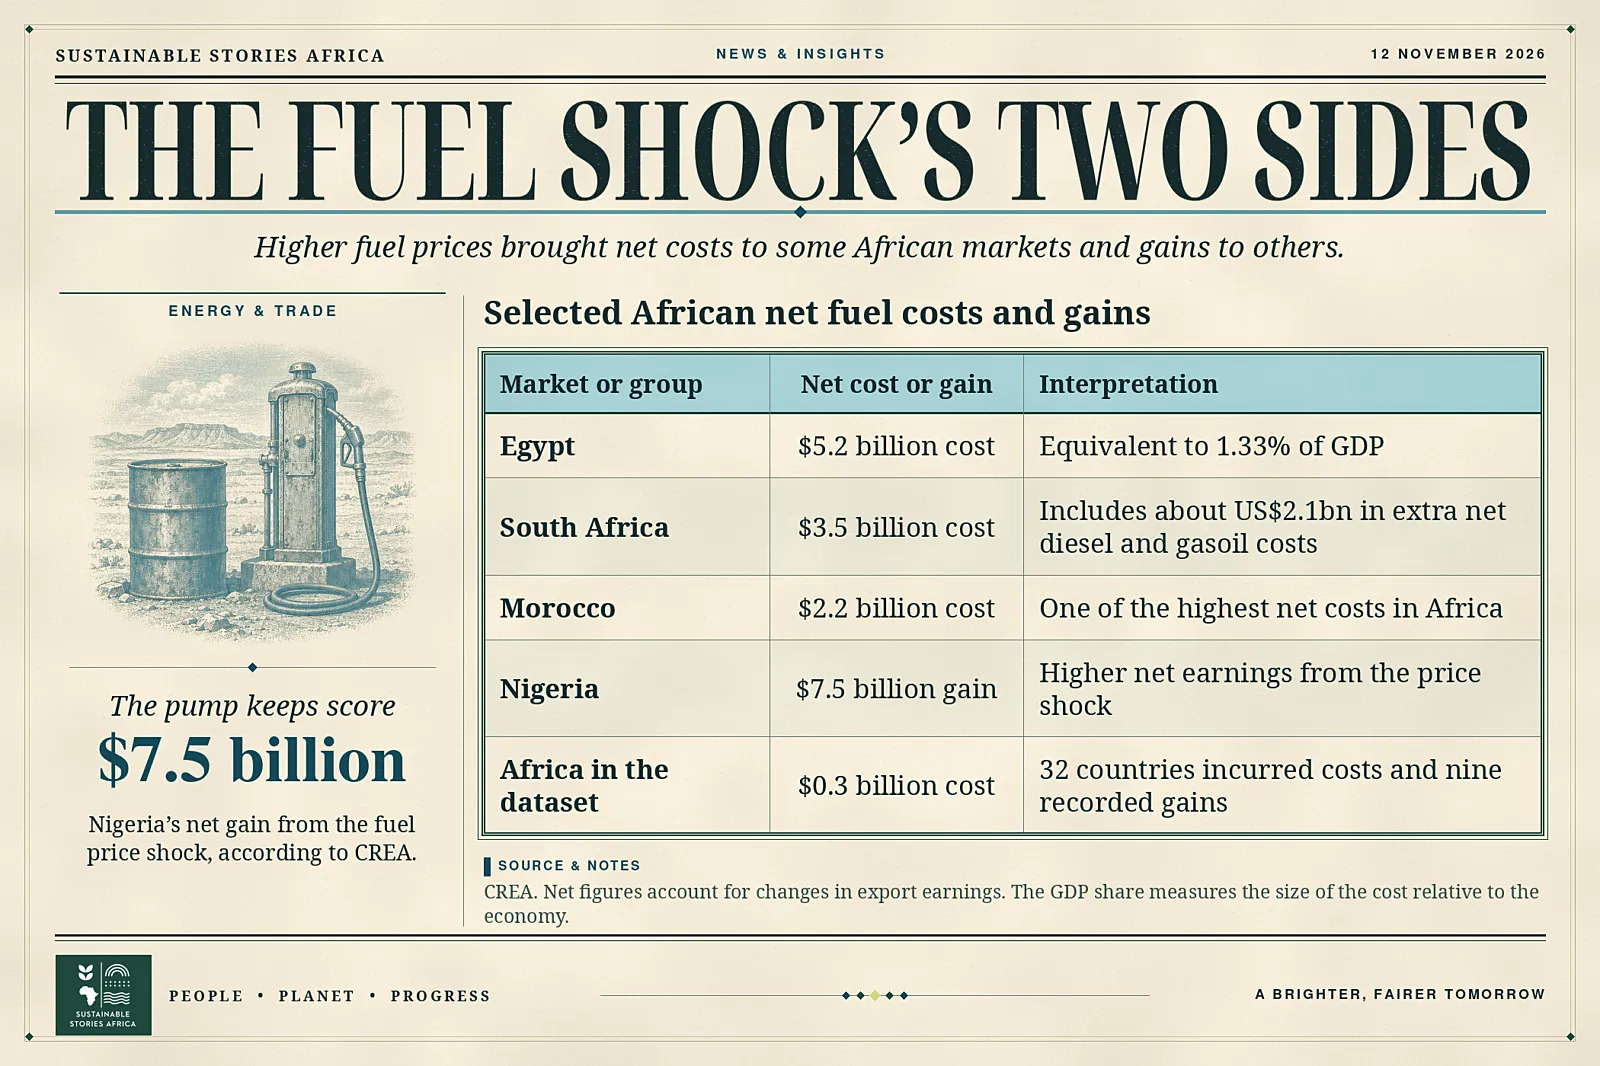
Egypt and South Africa were among the African countries facing substantial net costs.
Higher export earnings benefited Nigeria.
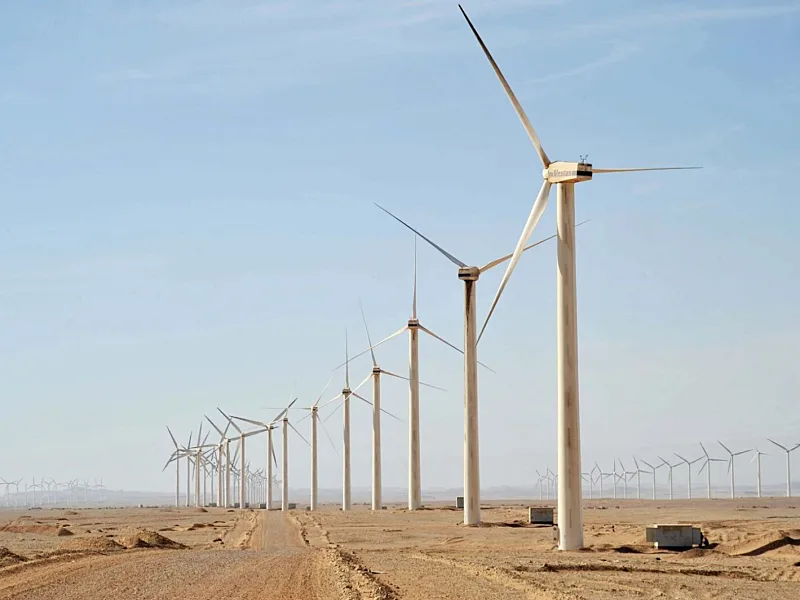
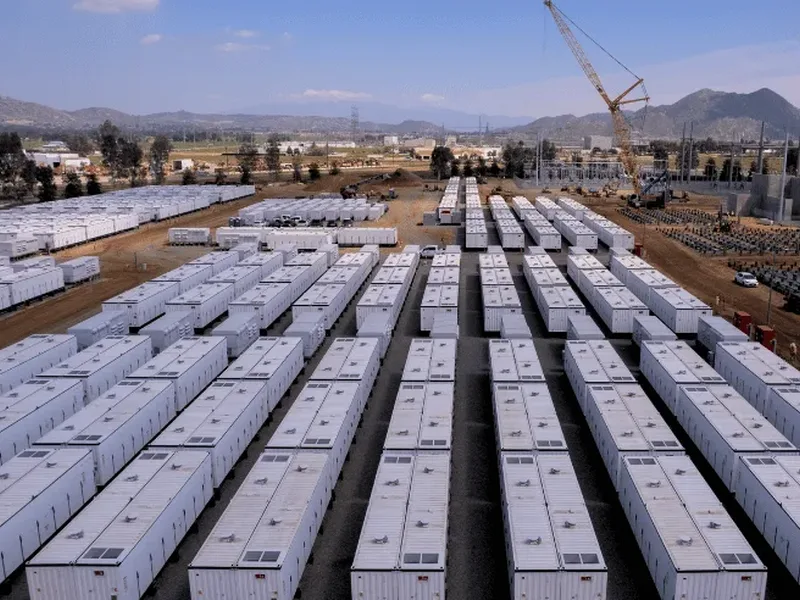
Clean power added since 2020 helped importers avoid an estimated $36 billion in fuel purchases over a separate five-month period.
The price shock reaches fuel buyers
The disruption around the Strait of Hormuz added an estimated $330 billion to the gross cost of seaborne crude, refined fuels and liquefied natural gas imports between March and August 2026, according to the Centre for Research on Energy and Clean Air (CREA).
- In its 26 August analysis, the research group compared prices after the US and Israeli strikes on Iran with the prices that futures markets had anticipated before the strikes.
The estimate uses observed arrivals for March to July and modelled arrivals for August, when the available trading data covered only part of the month.
It measures extra expenditure on fuels covered by the study and deducts gains for countries that also export.
- The estimate excludes freight costs, war-risk insurance and pipeline gas, among other items.
- It also excludes the economic cost to buyers who cut their purchases because they could no longer afford them.
African countries face very different costs
CREA estimated that 32 of the 41 African countries in its dataset faced a combined higher net cost of $21.9 billion, while nine earned $21.6 billion.
This left a regional net cost of about $300 million, masking a much wider exposure in individual economies.
- Egypt faced the highest net cost in Africa.
- Nigeria’s additional export earnings exceeded Egypt’s additional costs.
Diesel shows why exposure differs
Crude oil accounted for an estimated $164.1 billion in gross extra costs globally, with diesel and gasoil adding $73.8 billion.
- On CREA’s benchmark comparisons, diesel averaged 59% above pre-war expectations, while crude averaged 35% above.
- The difference matters for road haulage, farm equipment and industry.
Even when crude prices ease, fuel buyers can remain exposed if diesel prices fall more slowly.
Those figures reflect wholesale benchmarks.
- The price a farmer pays to run equipment or a haulier pays to move goods will also depend on exchange rates, taxes, subsidies and margins.
- Governments that absorb some of the increase through fuel subsidies face a budget cost.
When suppliers pass it through, households may encounter it indirectly in transport fares or the price of delivered goods.
- How quickly that happens varies by market and contract.
These channels matter even in countries that export some fuel.
Clean power cushions part of the shock
CREA also modelled how much fuel importers would have needed if clean electricity generation had stayed at 2020 levels.
- It estimated that generation added since then avoided $36 billion in coal, gas and oil imports from March to July, including about $10.6 billion attributable to the wartime price premium.
- The savings estimate covers a different period and a broader set of fuels than the $330 billion figure.
Each addresses a different question about import exposure.
The gains from clean power depend on which fuel it replaces.
- A solar project can lower the need for fuel-fired electricity during daylight.
- A country that relies heavily on diesel for freight has separate exposure sources.
- Utilities, transport planners and finance ministries therefore need to identify which uses form the largest import risks.
This can guide choices on electricity supply, energy efficiency and the gradual shift of some transport and industrial demand to electricity.
For national income, the burden differs.
- CREA estimated that a typical low- or lower-middle-income importer faced extra costs equivalent to 1% of GDP, compared with 0.45% for a typical high-income importer.
- Egypt’s 1.33% shows how a smaller economy can face a greater relative burden than countries with larger dollar-term bills.
- A share of GDP expresses the extra payment relative to the size of the economy.
The ratio puts import costs on a comparable scale across economies.
The study used futures prices because they record what traders expected to pay in each delivery month before the crisis.
- Fuel prices can change for other reasons, too.
- The comparison tells readers how far prices moved above those expectations on the volumes bought.
A separate assessment would be needed to determine how the additional costs affected household budgets, company profits and public finances in each country.
Path Forward – Reducing Exposure To Future Fuel Shocks
Fuel-importing countries can use the breakdown by product to identify where higher prices reach budgets, businesses and households.
Energy plans can then track avoided fuel purchases alongside new generation, grid reliability and changes in transport fuel use.
These measures show where investment is reducing vulnerability to the next supply disruption.