
South Africa’s official unemployment rate rose to 33.7% in the third quarter, from 33.6% in the previous quarter.
Statistics South Africa counted 101,000 more people employed and 97,000 more unemployed.
Formal employment increased, while informal and household employment fell.
The youth unemployment rate remained above 47%.
The labour force expands again
South Africa’s official unemployment rate rose by 0.1 percentage point to 33.7% in the third quarter of 2026 even as employment increased, Statistics South Africa reported on 10 November.
- Its Quarterly Labour Force Survey counted 16.8 million employed people and 8.6 million unemployed people.
- The labour force expanded by 198,000 as both groups grew.
The figures describe movements in survey estimates over the quarter, during which people could enter employment, begin looking for work or leave the labour market.
The rate measures unemployed people as a share of the labour force.
- It can rise when job creation and the number of people seeking work increase at the same time.
- It can also miss some of the pressure on people who are available for work but have stopped looking.
The survey counted 70,000 more discouraged jobseekers, bringing that group to 3.7 million.
Broader measures capture more labour pressure
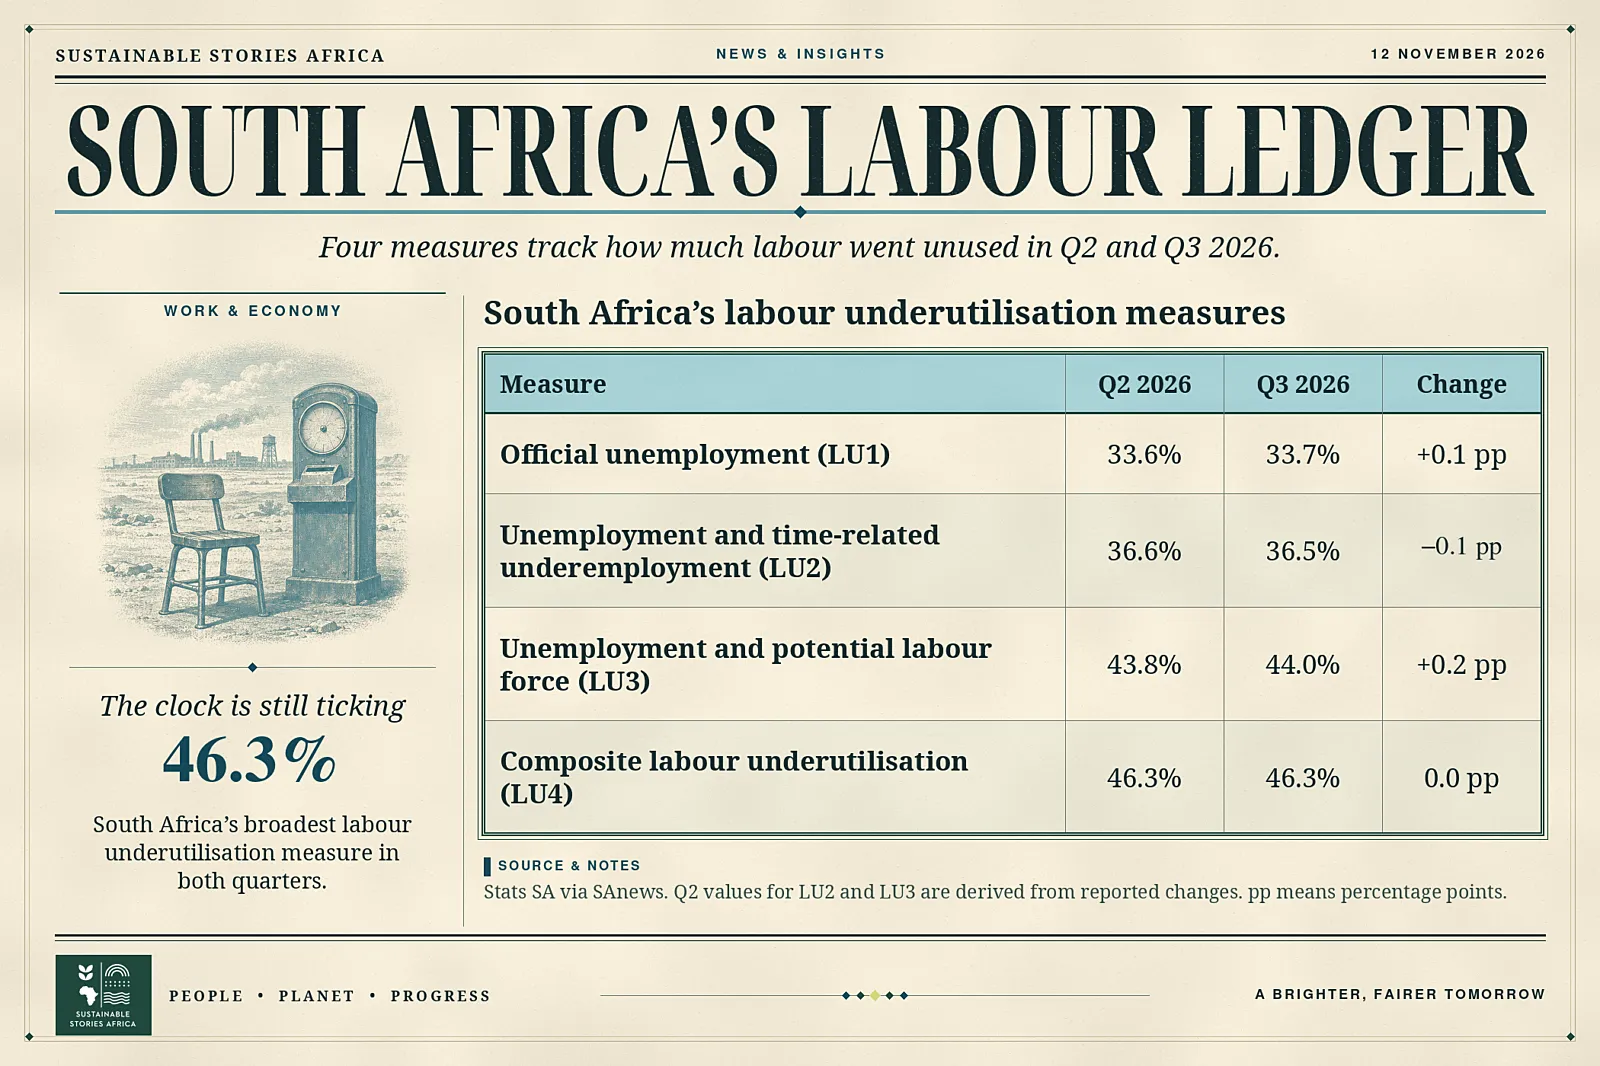
Stats SA publishes three additional measures that include different groups of workers or jobseekers.
- The rate that combines unemployment with time-related underemployment fell slightly, while the rate that also covers people in the potential labour force increased.
- Its broadest measure held at 46.3%.
The four figures help distinguish the difficulty of finding work from the difficulty of finding enough hours or staying connected to a job search.
Formal employment accounts for the gains
Formal employment rose by 268,000 to 12.3 million, more than the net gain across the economy.
- Informal employment fell by 98,000 and household employment by 68,000.
- Finance recorded the largest reported industry gain, adding 111,000 employed people, followed by manufacturing and mining among the leading gainers.
- Private households and agriculture recorded declines. Those changes describe where the survey found people working.
They do not show individuals moving from one type of job into another.
Stats SA counted 4.6 million people in the potential labour force, up by 69,000.
- That group includes people who are available for work but not looking, as well as people who are looking and are unavailable.
- The number outside the labour force for other reasons fell by 150,000.
- Taken together, those moves show why comparisons should account for changes in participation alongside changes in hiring.
Even when employment rises, more people compete for work and more discouraged workers are on the margins of the labour market.
The figures also varied by province.
- Employment increased by 48,000 in the Western Cape and 45,000 in North West.
- Free State lost 34,000 and Mpumalanga lost 30,000.
- The differences matter for employers and training providers.
An expansion in vacancies in one province can offer few practical options to an applicant elsewhere if moving is costly or the work requires credentials they do not have.
Youth figures show a difficult market
Among people aged 15 to 34, the unemployment rate edged down to 47.3%; however, employment in the group fell by 5,000 to 5.5 million.
- The number of unemployed young people fell by 23,000 to 5 million.
- Reading the employment count alongside the rate gives a clearer account of young people’s prospects.
The quarter showed fewer young people in employment and fewer classified as unemployed, so the lower rate alone gives an incomplete picture.
For a young person searching for a first job, the next step may be an interview, a placement or simply enough income to continue searching.
- National averages cannot show whether a placement leads to steady work, or whether jobs are appearing where candidates can reach them.
- Provincial and industry breakdowns can help employers and training providers choose where to focus, while placement and retention figures can show whether those efforts lead to durable jobs.
The informal and household sectors, too, warrant attention.
- A national employment gain can coexist with a decline in the kinds of work that some households depend on for their income.
- The next survey will show whether this quarter’s pattern persists.
Repeated gains across several industries and provinces would indicate whether access to work is improving rather than a single quarter’s growth concentrated in a few sectors.
Path Forward – Tracking Jobs Beyond The Headline Rate
Future releases should be read alongside youth employment, discouraged jobseeker counts and provincial trends.
Together they will show whether access to work is improving.
For employers and training providers, progress can also be measured through placements that lead to sustained employment, particularly for people seeking their first job.