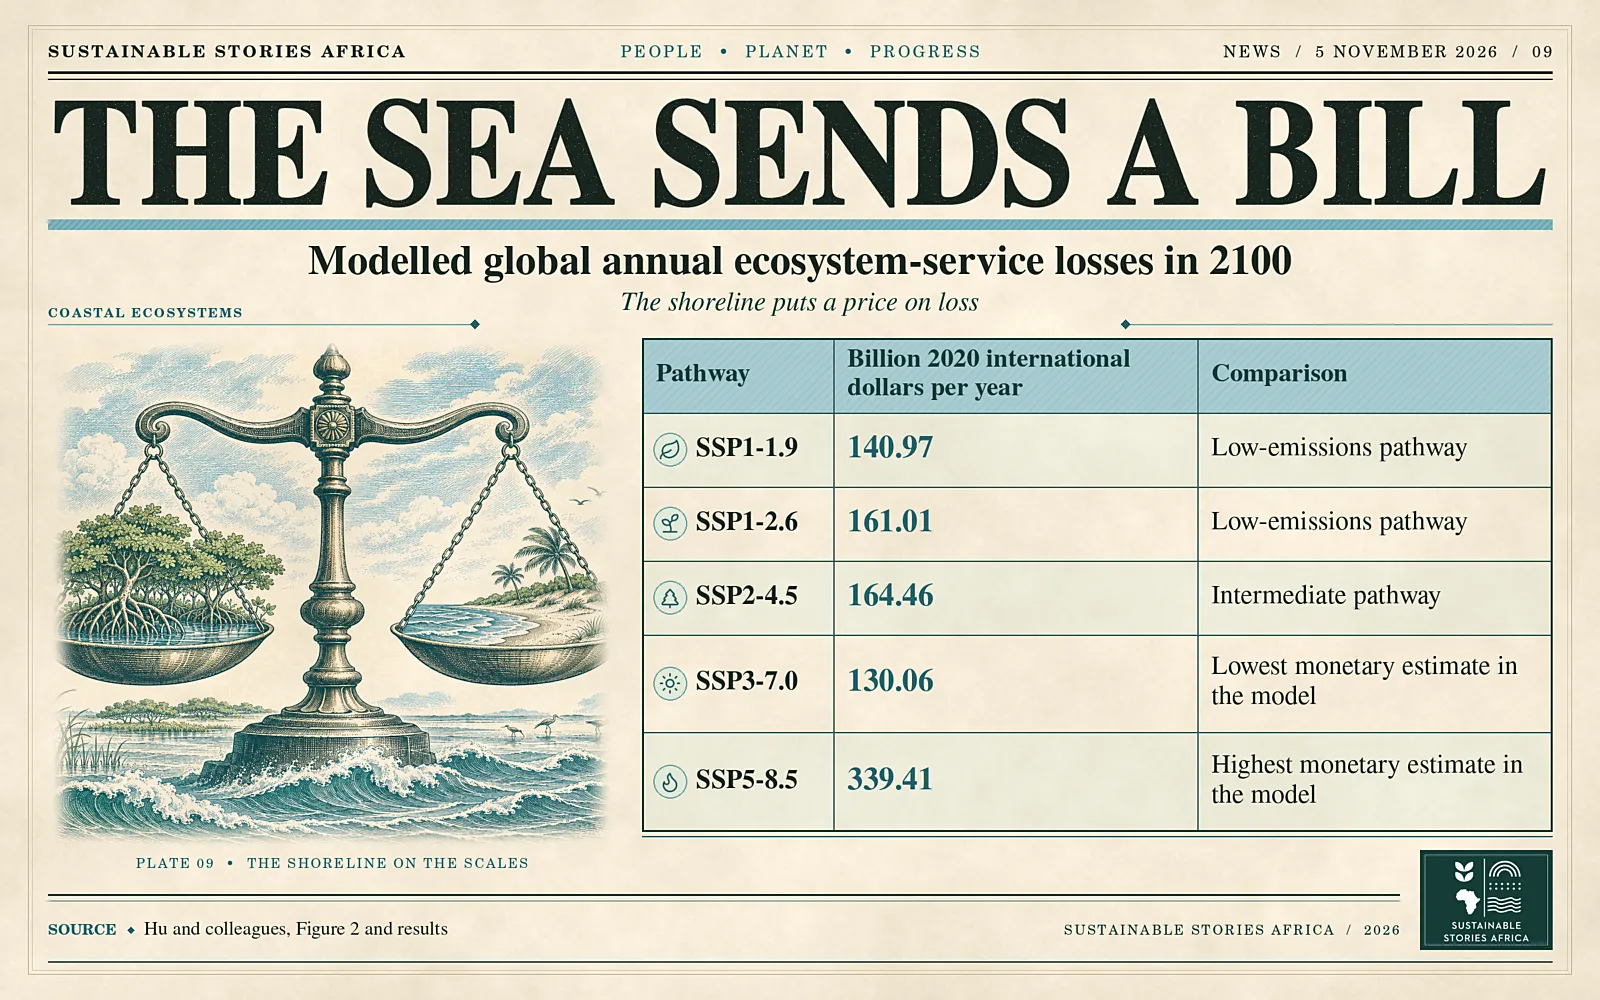
A global study projects annual losses in coastal ecosystem-service value of about 130 billion to 339 billion international dollars in 2100, depending on the scenario.
Wetlands show the largest proportional losses among the land-cover classes assessed.
Some low-lying and lower-emitting countries face disproportionate losses relative to the services their ecosystems provide.
A global loss with a different map of exposure
Sea-level rise could erase between 130.06 billion and 339.41 billion in annual ecosystem-service value by 2100, measured in 2020 international dollars, according to a study published in PNAS Nexus on 3 November.
- Hongyu Hu and colleagues combined sea-level projections with land-cover and valuation data across five socioeconomic and climate pathways.
- They found that the countries with the largest monetary losses and those losing the greatest share of their ecosystem value often differ.
Ecosystem services are benefits people receive from nature or from land managed in particular ways.
- A wetland can help buffer floods and support fisheries. Cropland supports food production.
The study converts estimated changes in these services into a common monetary measure.
The results represent modelled annual losses in value in 2100, excluding the water land-cover class from the headline global loss calculation.
How income assumptions shape the ranking of losses
The estimates combine two kinds of change.
- Each pathway has a sea-level trajectory that affects how much land is exposed.
- It also has income assumptions that affect the monetary value assigned to the services.
The authors therefore caution against interpreting the figures as a simple ranking by emissions.
In their calculation, SSP3-7.0 gives a lower monetary loss than SSP1-1.9, while SSP5-8.5 gives the highest estimate.
- Wetlands lose 1.21% of their modelled value under SSP1-1.9 and 2.20% under SSP5-8.5, the highest relative losses among the non-water classes.
- Built surfaces and cropland account for roughly 59% to 60% of absolute losses across the pathways.
The difference between these measures matters for deciding which places and systems to protect.
An international dollar adjusts for differences in purchasing power across countries.
- In the study, the values are expressed in 2020 terms and vary with assumptions about income.
- They describe losses of ecosystem services compared with a scenario without sea-level rise.
- They are a different measure from repair bills, property damage or cash transfers that governments might negotiate after a disaster.
Why relative loss matters for low-lying countries
China leads the absolute loss ranking in the intermediate pathway.
- Egypt and the Bahamas appear among countries with some of the largest relative losses, which the researchers measure against a counterfactual with no sea-level rise.
This comparison brings attention to places where losses can remove a significant share of the benefits that coastal land provides even if the monetary total is smaller than in a larger economy.
The authors also compare historical carbon dioxide emissions per person with future losses per person.
- Under the intermediate pathway, their index of the mismatch rises from 0.401 in 2050 to 0.500 in 2100.
The index measures the distribution identified in the study.
- A coastal budget or loss-and-damage assessment would still need local information about who uses the affected ecosystems and which services would be hardest to replace.
The paper finds that losses generally accelerate after 2060 within each pathway.
- This timing matters for assets and policies intended to last for decades.
- A coastal road or settlement plan adopted today can shape land use well beyond mid-century.
Comparing exposure over the lifetime of the investment can identify places where a design or conservation decision will become more consequential over time.
Use global estimates to guide local assessments
Coastal authorities can use an exposure map to identify wetlands, farmland or built areas that need closer study.
- A local assessment can examine flood protection, fisheries and livelihoods alongside the amount of exposed land.
- This can help explain why two places with similar estimates of inundation may face different consequences.
International climate finance can also distinguish between the largest monetary losses and the most acute losses relative to a country’s resources.
- Looking at both measures can inform adaptation priorities for deltas and small islands.
- It also gives negotiators a way to discuss why the historical responsibility for warming and the burden of coastal losses may fall in different places.
National averages can conceal differences within a country.
- People living near an estuary may depend on a wetland for flood protection or income in ways a national account cannot describe.
Pairing exposure estimates with local information about livelihoods can help planners see which services are essential and what households would face if those services were lost.
Path Forward – Put Coastal Services Into Adaptation Decisions
The study identifies exposed ecosystems and countries that could face disproportionate losses.
Local assessments can show which communities depend on those services and how much protection is feasible.
That evidence can inform wetland protection, coastal planning and decisions about where adaptation finance is most needed.