Plastic waste travels far beyond its point of dumping, tracing water systems into biodiversity hotspots.
In Colombia, waste flows 1,000 kilometres down the Magdalena River, damaging Caribbean coral reefs and mangroves.
Nigerian fishers report rising fish mortality due to ever-increasing plastic accumulation, while Borneo's endangered dolphins face entanglement in discarded gear.
The WEF's June 2026 report maps this crisis with scientific precision, converting a diffuse environmental threat into targeted investment and governance priorities, directly relevant to Africa's own river basins and coastlines.
Mapping Plastic's Path of Destruction
Source-to-sea thinking is transforming how governments, companies, and communities understand plastic pollution, and the WEF's field research across nine countries provides the most detailed geographic evidence yet of where plastic waste intersects with biodiversity loss to inflict maximum economic and ecological damage.
Section 2 of the WEF Global Plastic Action Partnership report introduces a geographic framework for tracking plastic waste pathways from source (urban waste generation) to sea (coastal and marine biodiversity), with each country developing national risk maps that overlay plastic pollution intensity with biodiversity data to identify priority intervention hotspots.
Water Is the Plastic Highway
The most important insight in the WEF's geographic analysis is also the simplest: plastic follows water.
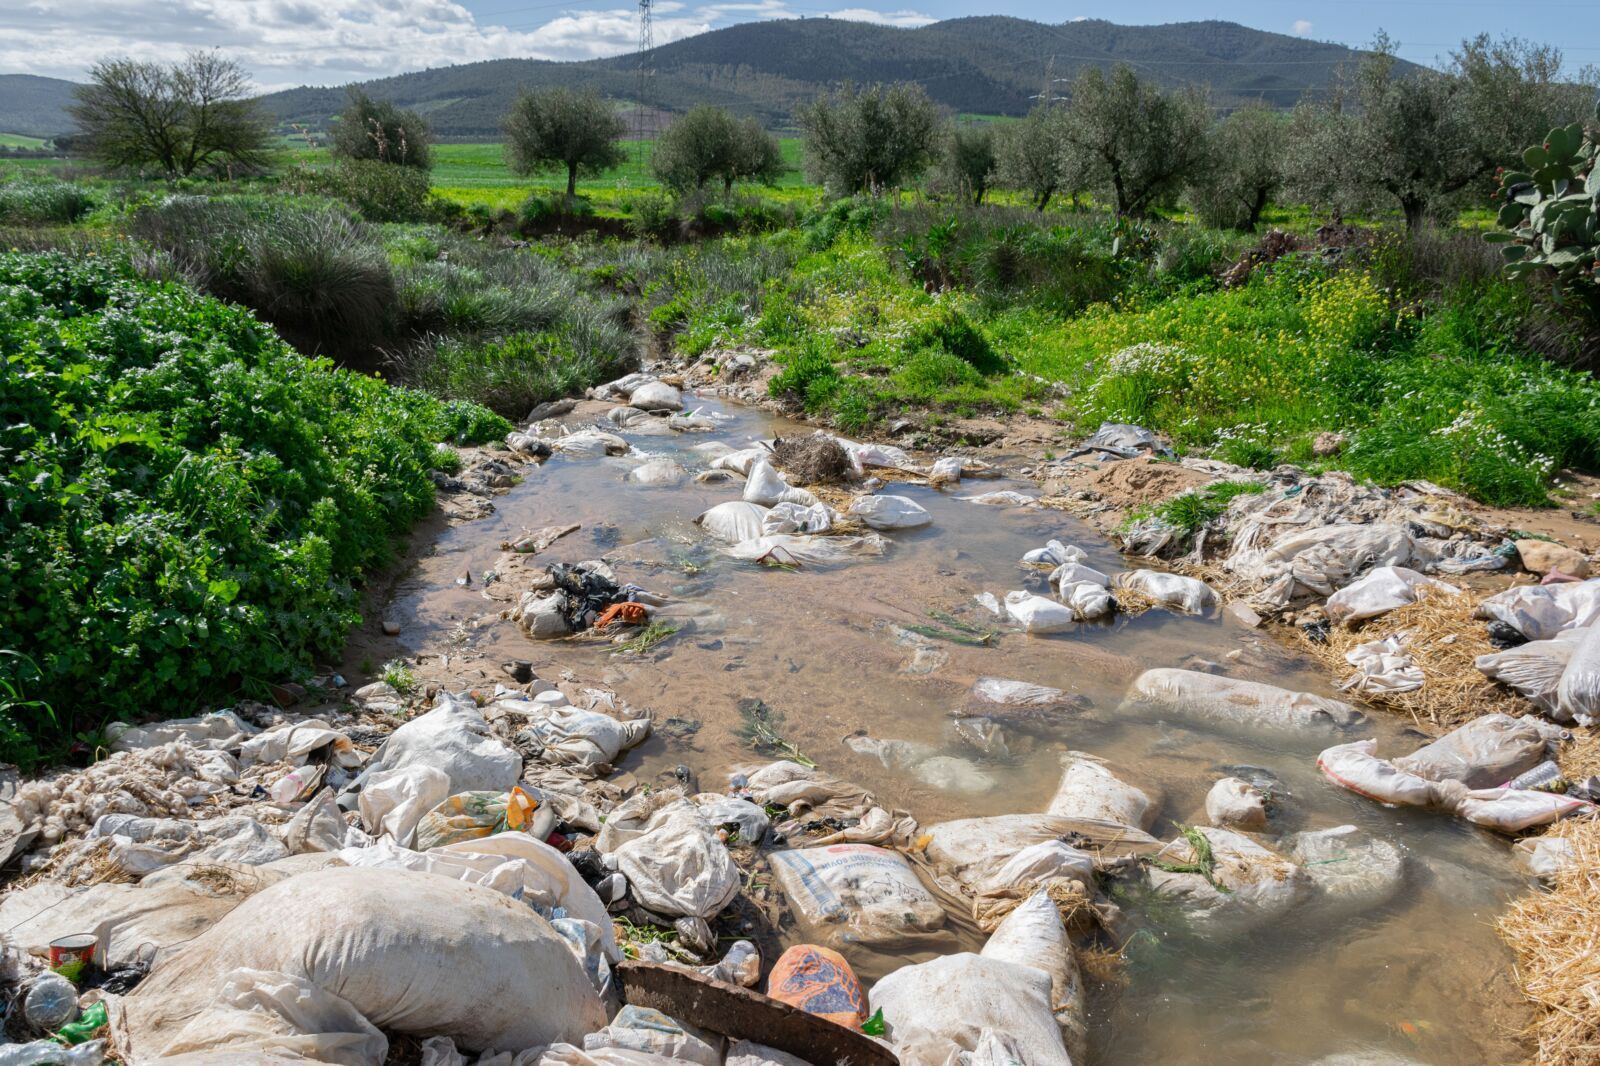
In urban areas, rainfall-driven runoff transports waste into drains and ravines, where it fragments into microplastics.
River basins then act as vectors, conveying waste downstream into biodiversity-rich wetlands, floodplains, mangroves, and estuaries.
Seasonal rains amplify this flow, propelling plastic towards coastlines where it accumulates in the most ecologically sensitive environments.
This dynamic has been documented with startling specificity:
- Colombia: The Magdalena-Cauca river basin conveys approximately 18,000 tonnes of plastic waste every year down to the Caribbean Sea, damaging the coral reefs and mangroves that are invisible to the urban waste managers responsible for the cities where it originates.
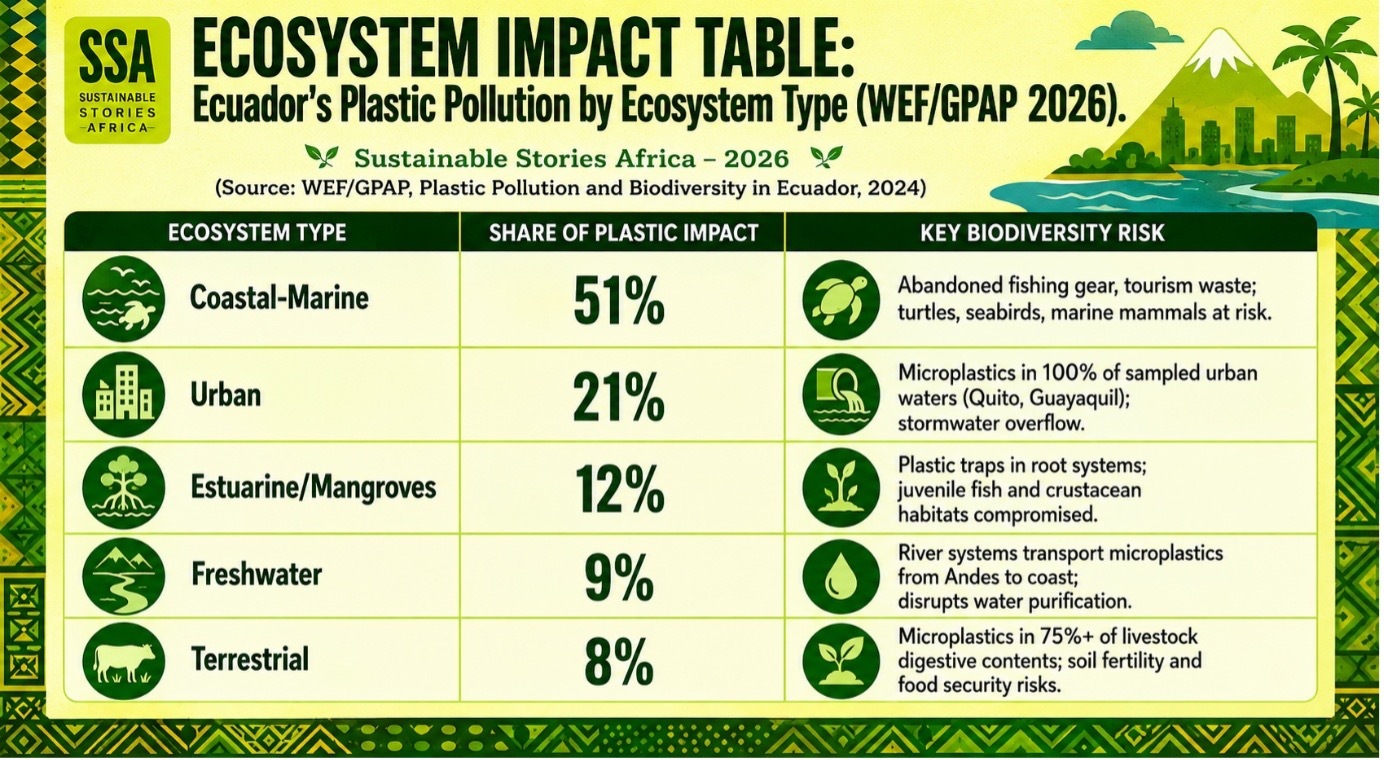
- Ecuador: Plastic pollution hotspots are concentrated along coastal provinces, with microplastics reaching densities of 4,200 particles per kilogram in Amazon floodplain sediments, transported by the same seasonal floods that sustain the region's fisheries.
- Indonesia: 14% (510,000 hectares) of Indonesia's mangroves are exposed to high plastic waste leakage, while the country's marine aquaculture industry alone dumps over 80,000 tonnes of plastic ropes, buoys, and feed sacks into its oceans annually.
The National Risk Maps and What They Reveal
The WEF report's most analytically significant contribution is the set of national-level risk mapping tools developed in Peru, Ecuador, and Costa Rica, which combine plastic waste data with biodiversity indices to identify the territories where joint action will deliver the greatest return on investment.
In Peru
- Researchers developed a Plastic Biodiversity Risk Index (PBRI) that integrates biodiversity data, solid waste flows, water connectivity, and population density to produce a national hotspot map.
- The index identifies territories where the most sensitive ecosystems overlap with the highest plastic pollution intensity, enabling policymakers to target scarce resources where they will do the most good.
In Costa Rica
- The 220,000-plus recorded species represent over 11% of all known global species.
- Researchers cross-referenced a plastic pollution risk map with the Biodiversity Habitat Index (BHI) to classify territories by ecological condition and pollution pressure.
- The alarming finding: more than 35% of Costa Rica's Key Biodiversity Areas show some level of ecological conflict related to plastic pollution.
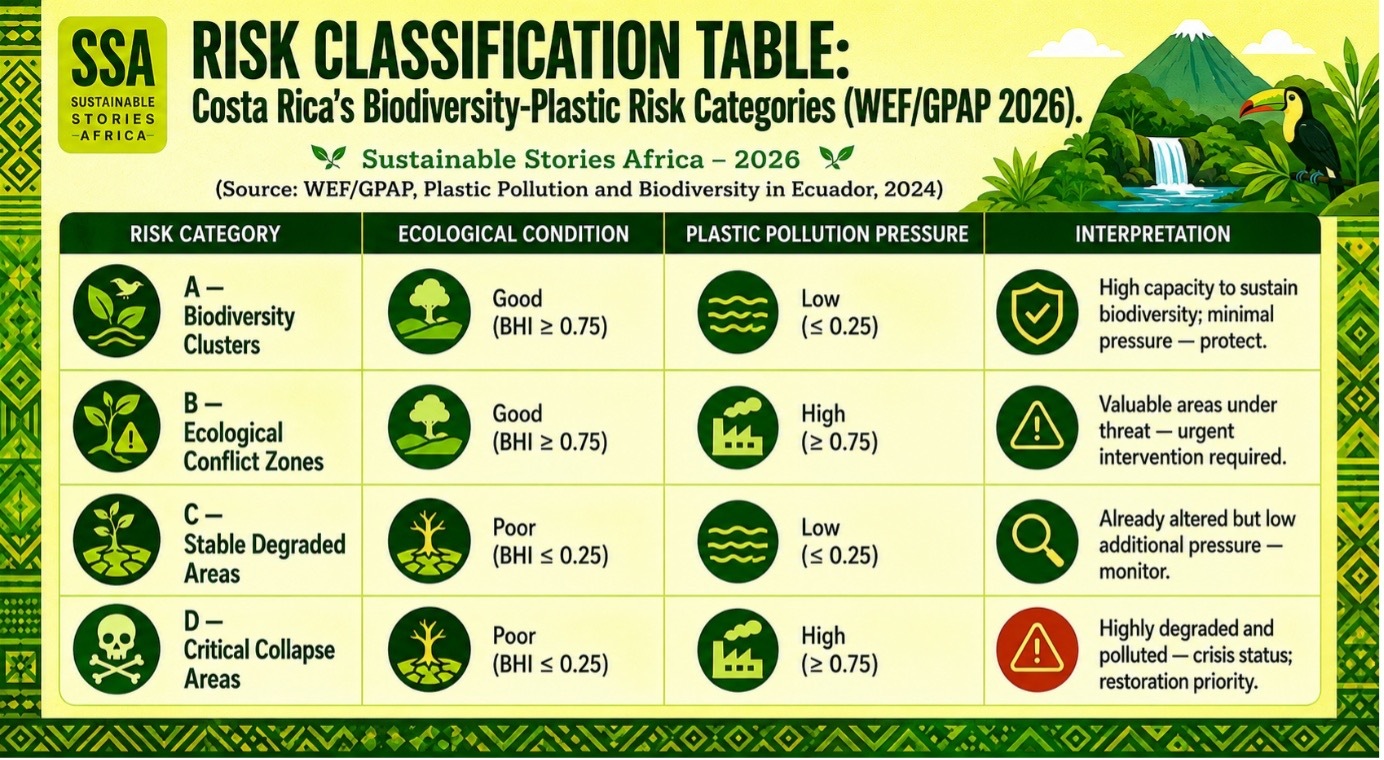
This four-category framework is immediately transferable: any African country conducting a national biodiversity strategy update or an EPR implementation plan could deploy this tool to identify where interventions will deliver the greatest biodiversity and economic returns.
Geography as a Governance Tool
The data makes a powerful political argument: geographic mapping of the plastic-biodiversity nexus breaks administrative silos by making the invisible visible.
In Colombia, the fact that plastic generated in inland cities damages coastal biodiversity over 1,000 kilometres away is a connection that urban waste ministries and coastal conservation agencies have historically never needed to make, until now.
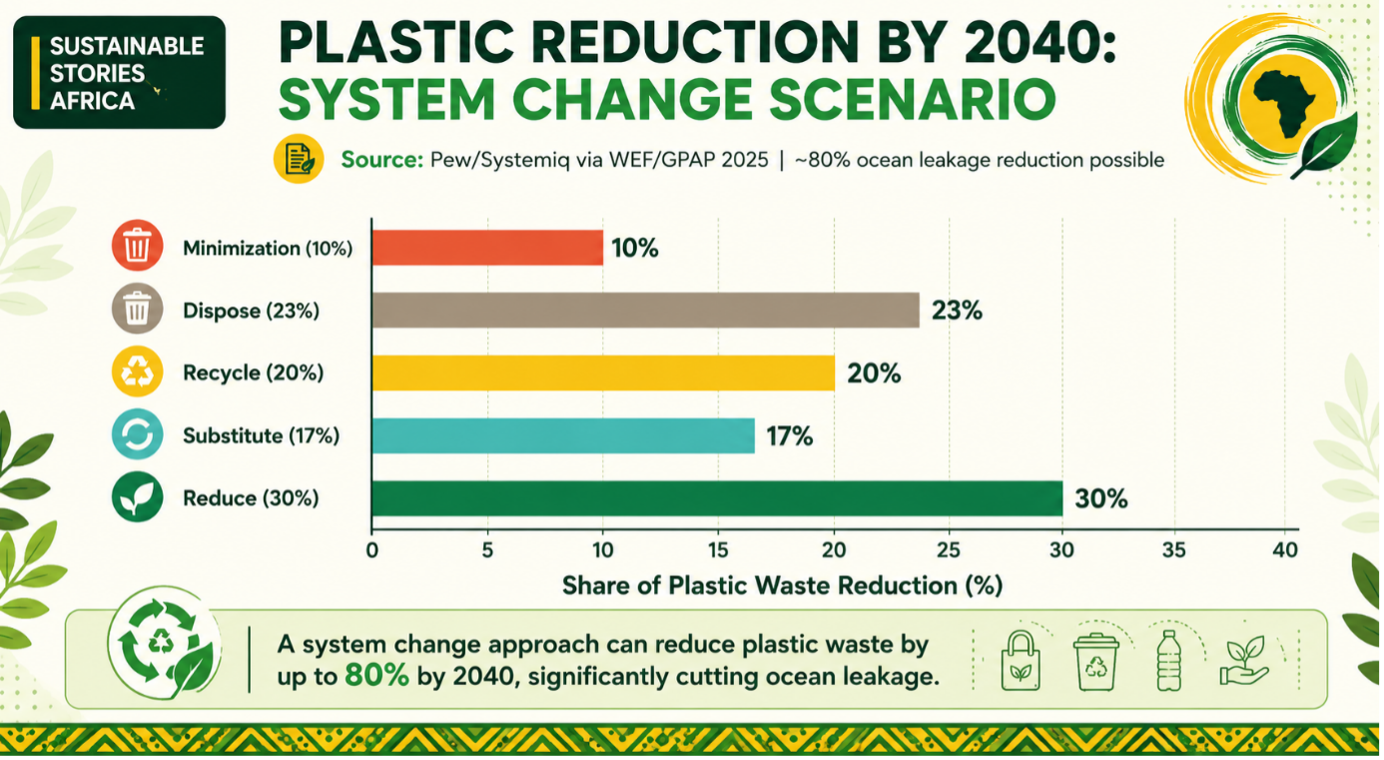
Under the WEF's System Change scenario, upstream solutions, eliminating avoidable plastics and substituting single-use packaging, can together reduce ocean-bound plastic leakage by nearly 50% by 2040, even before recycling improvements are counted.
However, achieving this requires governance systems that track plastic waste from source to sea and assign responsibility along the pathway, rather than just at the point of disposal.
For Africa, this is immediately relevant. The continent's major river systems – the Niger, Congo, Nile, Volta, and Zambezi – all flow through densely populated urban and agricultural corridors before reaching biodiverse coastal and marine environments.
Fishers in Nigeria's Nworie and Otammiri river ecosystem are already reporting increased fish mortality. The pathways are active. The mapping tools now exist to quantify and address them.
Three Geographic Governance Priorities
The WEF report recommends that governments integrate mapping approaches at national and municipal levels that combine plastic waste flows, zones of high-value biodiversity, and vital ecosystem services to highlight areas of greatest risk and highest potential returns on investment.
For Africa, this means:
- Commission national plastic-biodiversity risk maps for major river basins, starting with Nigeria, Ghana, Kenya, South Africa, and Mozambique, given their coastal biodiversity exposure.
- Align urban waste management mandates with coastal biodiversity governance, connecting upstream municipal authorities and downstream conservation agencies along shared ecological pathways.
- Integrate the geographic mapping framework into National Biodiversity Strategies and Action Plans (NBSAPs), making plastic pollution an explicit target consistent with GBF Targets 7 and 15.
Path Forward – Follow the Water, Protect the Wealth
The science is clear: plastic flows with water, and water sustains economic life. Every river basin that conveys plastic to a biodiverse estuary is a governance and investment challenge hiding in plain sight.
Africa's most productive ecosystems, its mangroves, coral reefs, wetlands, and river fisheries, are directly in plastic's path.
The tools to map, prioritise, and act are available. The WEF has demonstrated them across nine countries.
The next step is adaptation for African geographies, governance systems, and economies. The data shows where to start.