The WEF's 2026 Energy Transition Index ranked 120 countries, with Sweden leading and Nordic nations dominating the top 20.
However, only 24% of countries improved simultaneously across security, sustainability, and equity.
Kenya posted one of the strongest gains in global readiness. Namibia led Sub-Saharan Africa. In Nigeria, the continent's most populous nation and largest oil economy, it ranked 80th, reflecting both potential and structural challenges.
For African policymakers, investors, and sustainability practitioners, understanding these ETI scores is the essential first step toward translating climate ambition into a bankable transition strategy.
Reading the Rankings Beyond the Headlines
The WEF's Energy Transition Index is not simply a league table. It is a diagnostic framework.
A country's ETI score is a weighted composite of two sub-indices: System Performance (60% of the total score, covering equity, security and sustainability) and Transition Readiness (40%, covering regulation, finance, innovation, infrastructure, education and human capital).
Understanding the difference between a strong system performance score and a strong readiness score is critical; a country can have a well-performing energy system today while lacking the enabling conditions to sustain progress tomorrow.
Vice versa: a country can have weaker system performance but strong readiness foundations that position it for rapid improvement.
For African nations, this distinction carries particular weight.
Several African countries show relative strength in system performance, particularly in the sustainability dimension, driven by high hydropower shares and low per-capita emissions.
Transition readiness remains constrained by infrastructure gaps, financing costs and policy uncertainty.
Kenya's leap in readiness in 2026 demonstrates that this dynamic can shift quickly with the right enabling investments.
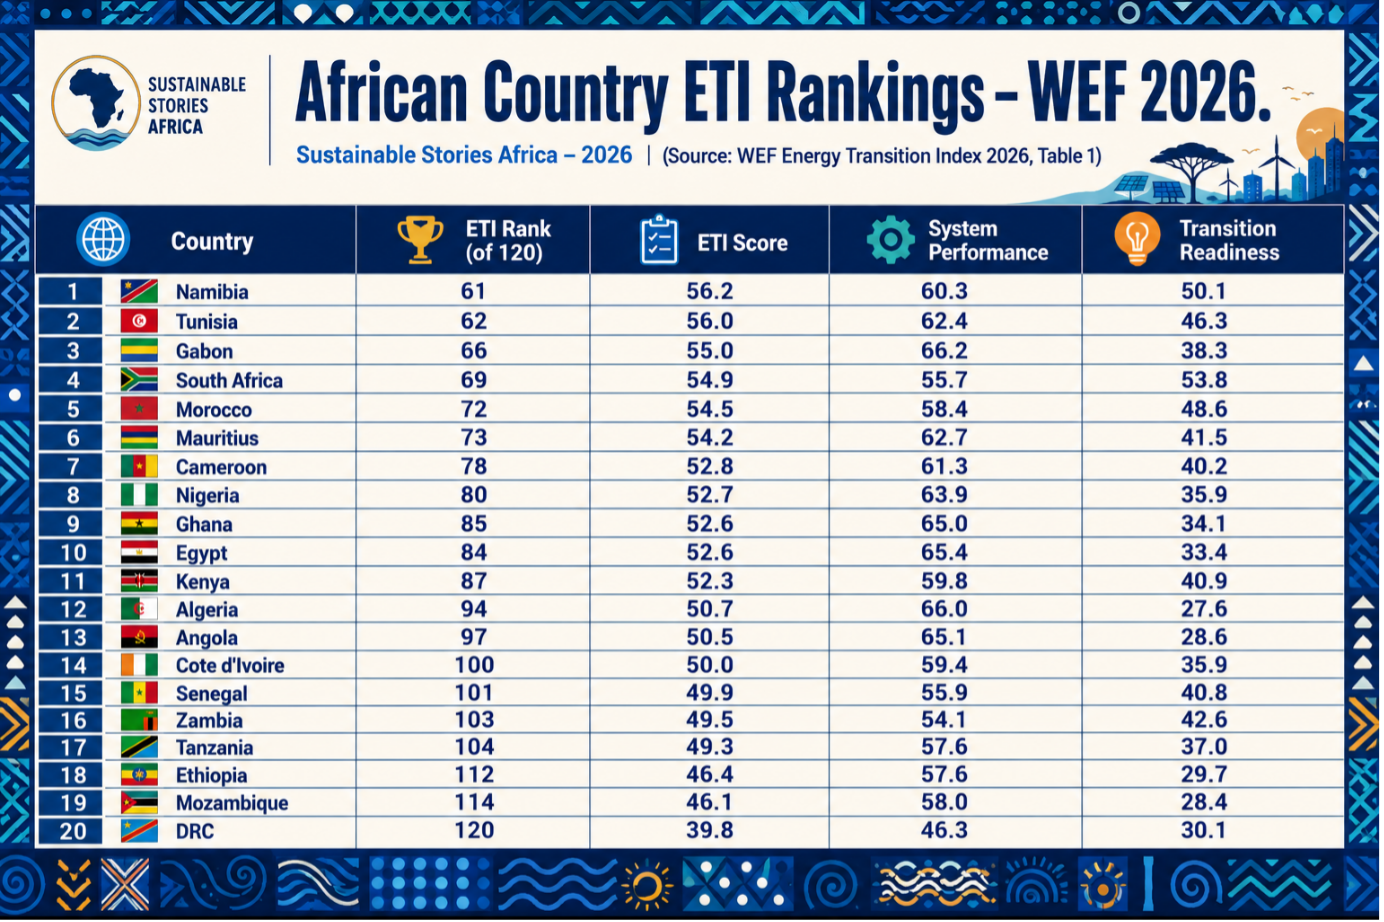
The Full African ETI Picture – 2026 Rankings for 20 African Countries
Four Stories From the African Data
Story 1: Kenya's Readiness Surge
- Kenya recorded one of the strongest transition readiness gains of any country globally in 2026, with its readiness score jumping by +8.7% year-on-year, driven by gains in extraordinary innovation (+58.7%), education and human capital (+19.9%) and finance and investment (+10.0%).
- This reflects the impact of Kenya's National Energy Policy 2025–2034 and the Kenya Energy Transition & Investment Plan 2023–2050, which together have catalysed R&D investment (rising from 0.4% to 0.8% of GDP), mobilised renewable energy financing and supported skills development in the clean energy sector.
- Kenya's experience is the most instructive example on the continent of what targeted, coordinated policy can do to readiness scores in a single year.
Story 2: Nigeria's High System Performance, Low Readiness Paradox
- Nigeria ranks 80th with an overall ETI score of 52.7; however, the striking thing is the 28-point gap between its system performance score (63.9) and its transition readiness score (35.9).
- Nigeria's energy system benefits from high domestic resource endowment, crude oil, natural gas and expanding solar capacity, lifting its system performance.
- However, its transition readiness reflects the structural constraints of policy inconsistency, infrastructure underinvestment and a difficult financing environment.
- Nigeria is the continent's quintessential case of resource strength failing to translate into transition capability.
Story 3: Sub-Saharan Africa's Sustainability Advantage
- Sub-Saharan Africa retains the highest average sustainability score of any global region in the ETI 2026, a direct reflection of the region's high hydropower penetration, low per-capita emissions and relatively low-carbon energy mix.
- Countries like Zambia, Mozambique, Ethiopia and the DRC sit atop significant hydropower resources that give them structural sustainability advantages even at lower income levels.
- Ghana and Nigeria both record system performance scores in the range of 63 – 65, above the global average of 61.5, driven partly by this sustainability component.
Story 4: Morocco and South Africa as Policy-Driven Outliers
- South Africa and Morocco represent the continent's most active transition policy environments. South Africa (rank 69, score 54.9) carries the strongest transition readiness score in Sub-Saharan Africa at 53.8, reflecting its relatively advanced regulatory and financial institutions.
- Morocco (rank 72, score 54.5) has built one of Africa's most compelling renewable energy track records, including solar capacity up 440% in less than a decade in analogous markets; it is now a regional leader in just transition planning.
Three African Transition Pathways and What Each Needs
The ETI data reveals three distinct African transition archetypes, each requiring different policy responses:
Archetype 1 – Resource-Rich, Readiness-Poor
- (Nigeria, Algeria, Angola, Gabon): High system performance driven by domestic resource strength; very low readiness constraining translation into clean transition. Priority need: regulatory reform, domestic capital mobilisation, institutional capacity.
Archetype 2 – Readiness-Building, System-Progressing
- (Kenya, South Africa, Morocco, Senegal): Improving readiness foundations; moderate system performance. Priority need: scaling finance at lower cost, accelerating grid and infrastructure investment, and manufacturing domestic transition inputs.
Archetype 3 – Sustainability-Strong, Structurally Constrained
- (Zambia, Ethiopia, DRC, Mozambique, Tanzania): High sustainability scores from hydropower and low emissions; very low readiness from financing gaps and infrastructure deficits. Priority need: concessional capital, international technology transfer, regional grid integration.
Using the ETI Data to Drive African Investment Decisions
Development banks, climate funds and private investors can use the ETI's three-archetype framework to direct capital with greater precision:
- AfDB and IFC should establish differentiated lending windows calibrated to the three archetypes, with lower-cost capital for Archetype 3 countries where commercial finance is most inaccessible and transition readiness most constrained
- African governments in Archetype 1 must treat their transition readiness scores as strategic liabilities and commission national readiness improvement plans that target the specific sub-dimensions dragging their rankings down
- Private clean energy investors active in Africa should weigh Kenya-style readiness momentum stories as leading indicators of near-term deal flow, using the ETI's readiness trend data as a forward-looking investment signal.
Path Forward: Africa's Rankings Are Data – the Response Must Be Strategy
From Ranking to Roadmap
The WEF ETI 2026 offers African governments, development banks, and investors the most comprehensive public benchmark of transition performance yet.
Sub-Saharan Africa's 1.2% regional improvement, the strongest globally, marks real progress, while Kenya's individual increase of over 8.7% in readiness proves that credible policy and targeted investment can outpace regional averages.
The question for every African country is not its current ranking, but what evidence-based actions will move that score in the direction citizens and economies need.